Stop Trusting One Speedtest: Use dd to Measure Network Speed and Stability
TL;DR
A single speed-test page gives you one moment, one protocol, and one selected server. It does not prove that your backup path, remote shell, VPN, container pull, or Agent request will remain usable for the next hour. A more reproducible baseline uses two endpoints you own or are explicitly allowed to test, sends a fixed payload repeatedly, and records direction, wall-clock time, exit code, spread, and errors.
ddfixes the byte count,sshcarries the stream, anddd of=/dev/nulldiscards it at the other end.This article turns
dd | ssh | ddinto a small network lab. It explains the easy-to-missiflag=fullblockdetail, shows upload/download and stability runs, interprets real sanitized measurements, and ships one-click scripts for Windows 11, Ubuntu 26.04, and macOS 26. Both a manual workflow and an Agent-assisted workflow are included. The scripts use small bounded payloads, write only to/dev/null, and do not depend on a third-party speed-test service. The measurements are from an authorized isolated lab and are not an SLA.
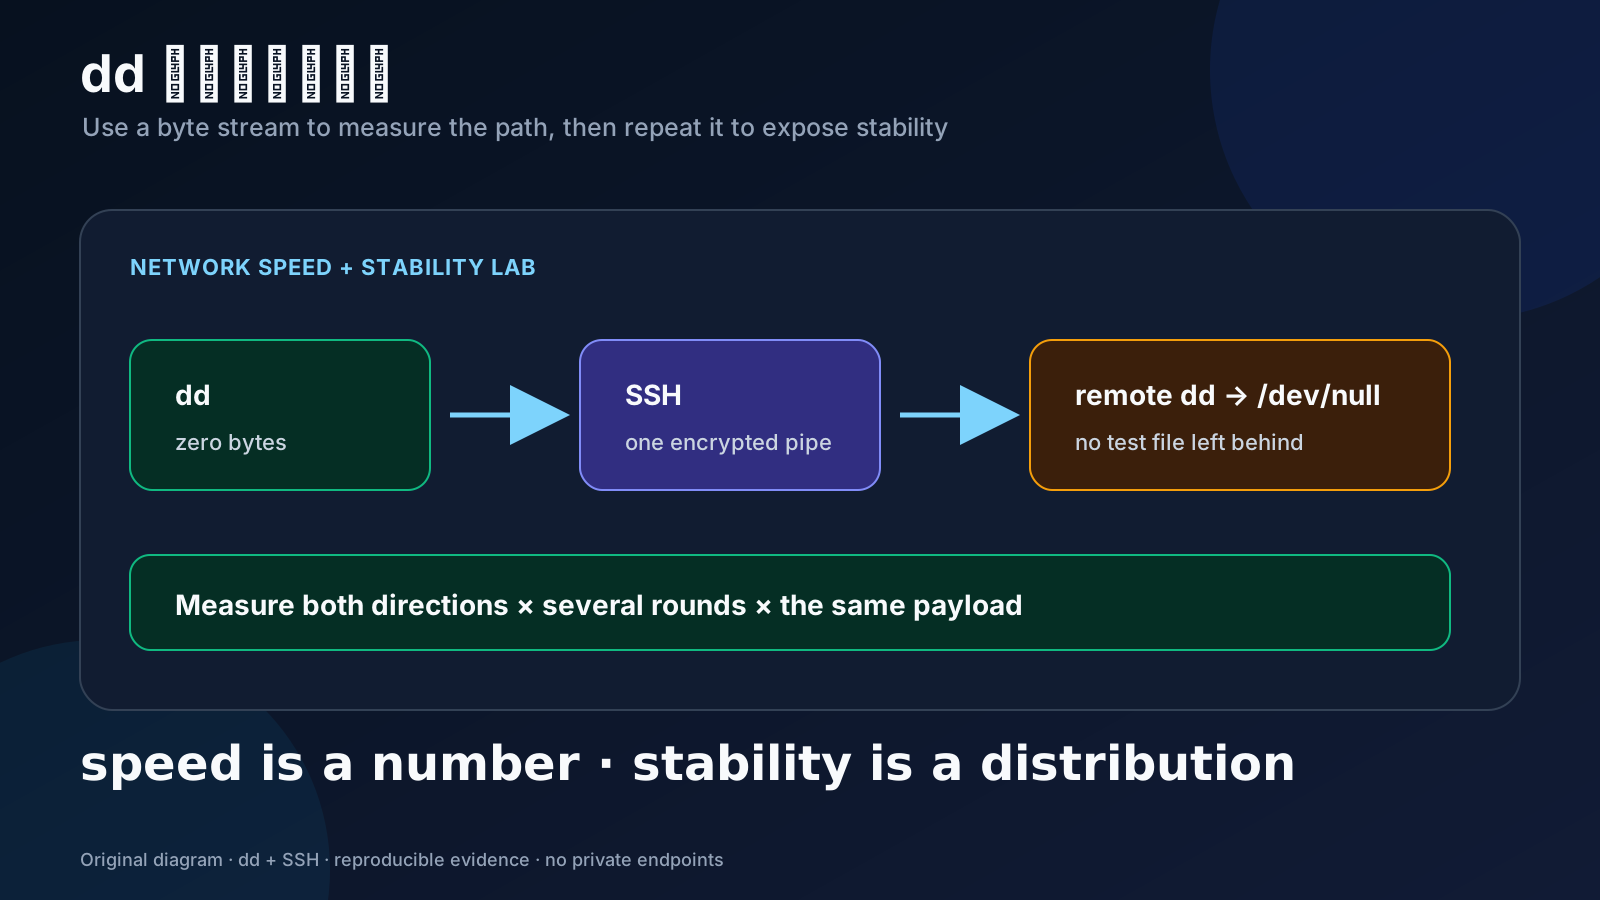
Figure 1: Original SVG cover. Speed is one number; stability is a distribution.
1. Background: why “800 Mbps” can still feel broken
A web speed test is one second of weather
When a link feels slow, most people open a speed-test page, see a large number, and conclude that the network is fine. That is a reasonable first check, but it is incomplete evidence.
A web test chooses the server, route, concurrency, protocol, and measurement window. The result means “this browser reached that service at this moment.” Your real workload may take another path: a backup target, a long-latency tunnel, a VPN exit, or a model request that goes through a proxy, TLS, and retries.
Think of a building’s water pipe. A faucet near the entrance can show a strong instant flow, while the top floor still suffers from pressure drops and a blocked valve. Network links have the same hidden variables: direction asymmetry, queueing, retransmission, connection setup, and long-tail latency.
Why dd is useful
dd is a byte mover. It reads from if (input file), moves fixed-size blocks (bs), reads count blocks, and writes them to of (output file). /dev/zero produces zero bytes; /dev/null consumes bytes. Put them on opposite sides of an SSH pipe and you get a deterministic payload without leaving a test file behind:
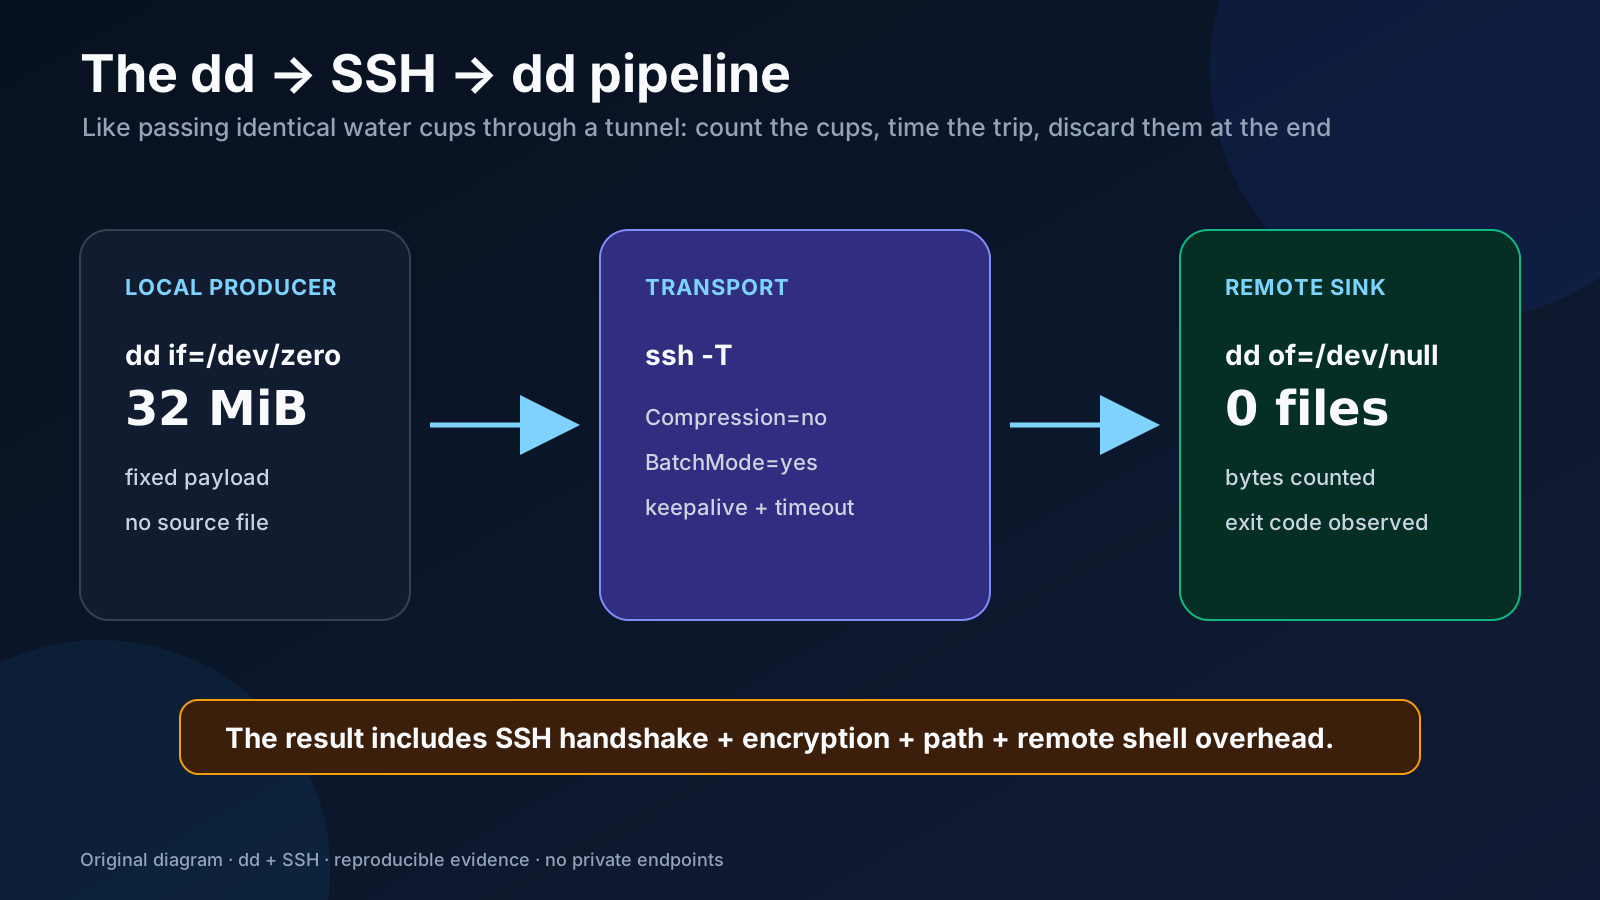
Figure 2: Original diagram. The measured wall time covers local production, SSH encryption, the path, and remote reception.
local dd if=/dev/zero ── pipe ──> ssh ──> remote dd of=/dev/null
This is not a raw wire-rate meter. It includes the SSH handshake, encryption, remote shell startup, and both CPUs. That is also its strength: it resembles the capacity an SSH-based application can actually use, instead of a marketing number for an unrelated protocol.
2. The dd detail that changes the result: iflag=fullblock
Four arguments, four measuring cups
if=/dev/zero: the source;of=/dev/null: the sink;bs=1048576: one MiB per block, written numerically for GNU/BSD portability;count=32: 32 complete blocks, or 32 MiB.
status=progress is handy interactively, but its support differs between GNU and BSD variants. The scripts therefore suppress noisy dd diagnostics and measure wall time themselves. Across a pipe, the important switch is iflag=fullblock: a short read() must not be counted as a complete record. dd keeps reading until the block is full.
Without it, a pipe can make a dangerous result look great. Suppose count=4 receives four 64 KiB short reads. dd exits after 256 KiB even though you thought you sent 4 MiB. Less data divided by less time produces an inflated MiB/s number. It is like counting four half-filled cups as four full cups.
Use full blocks even for the local baseline:
dd iflag=fullblock if=/dev/zero bs=1048576 count=32 \
  of=/dev/null 2>/dev/null
Four clocks hide inside one result
One transfer includes data production, SSH setup, wire time, and remote consumption. Combining them is fine, but the report must define the clock so another person can reproduce it.
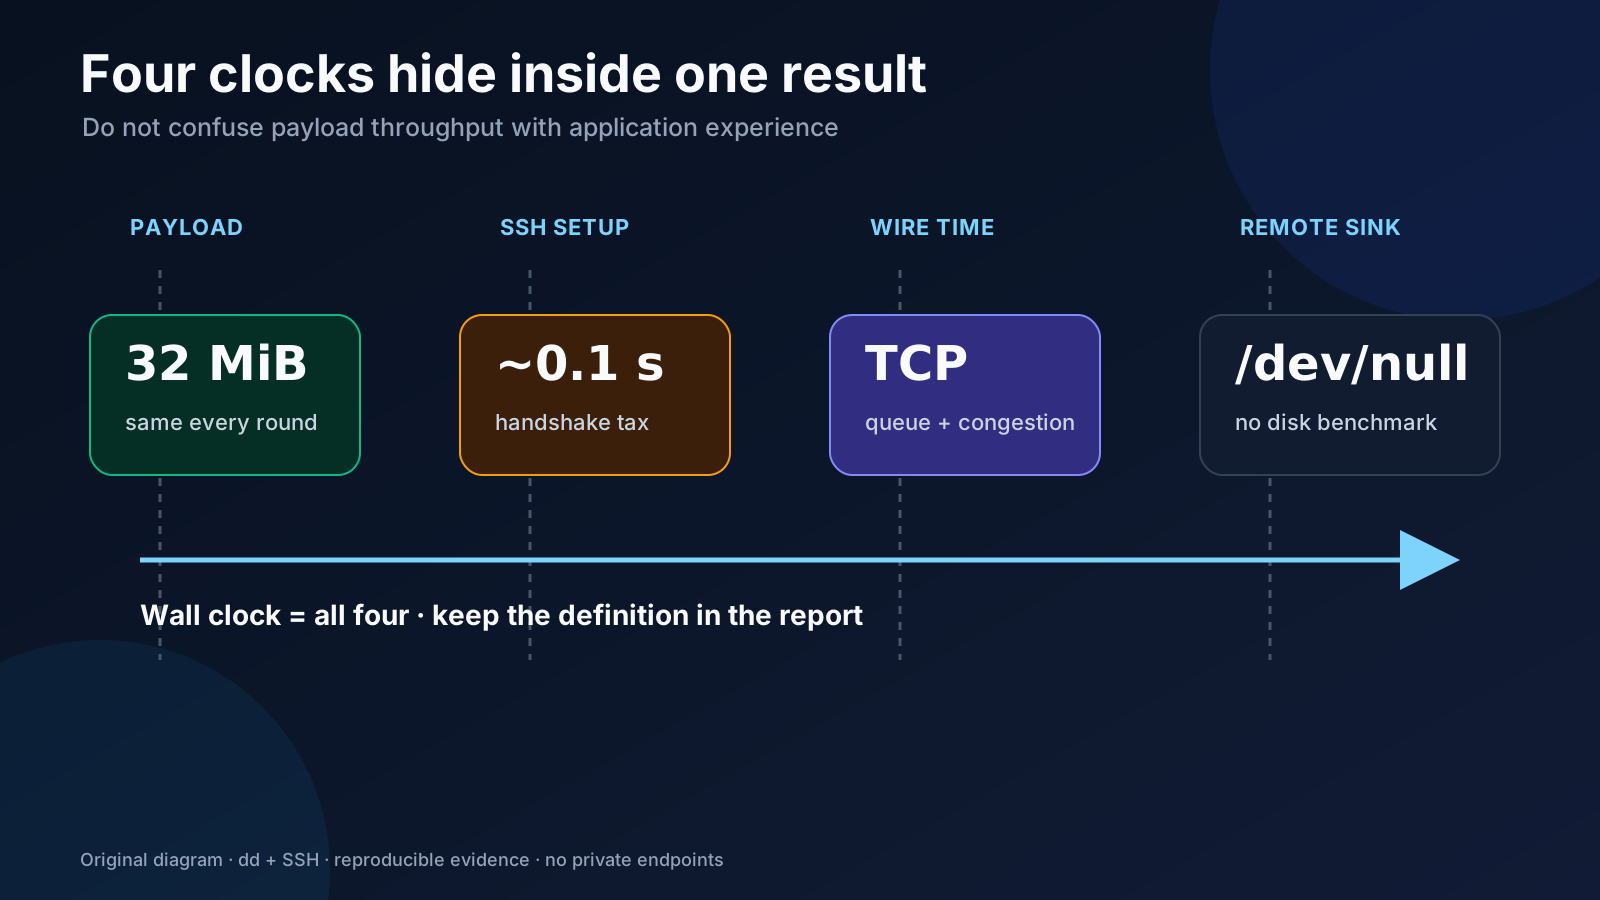
Figure 3: Original diagram. Small payloads are dominated by setup; larger payloads are closer to sustained throughput but consume more traffic.
3. Test design: baseline, both directions, then the distribution
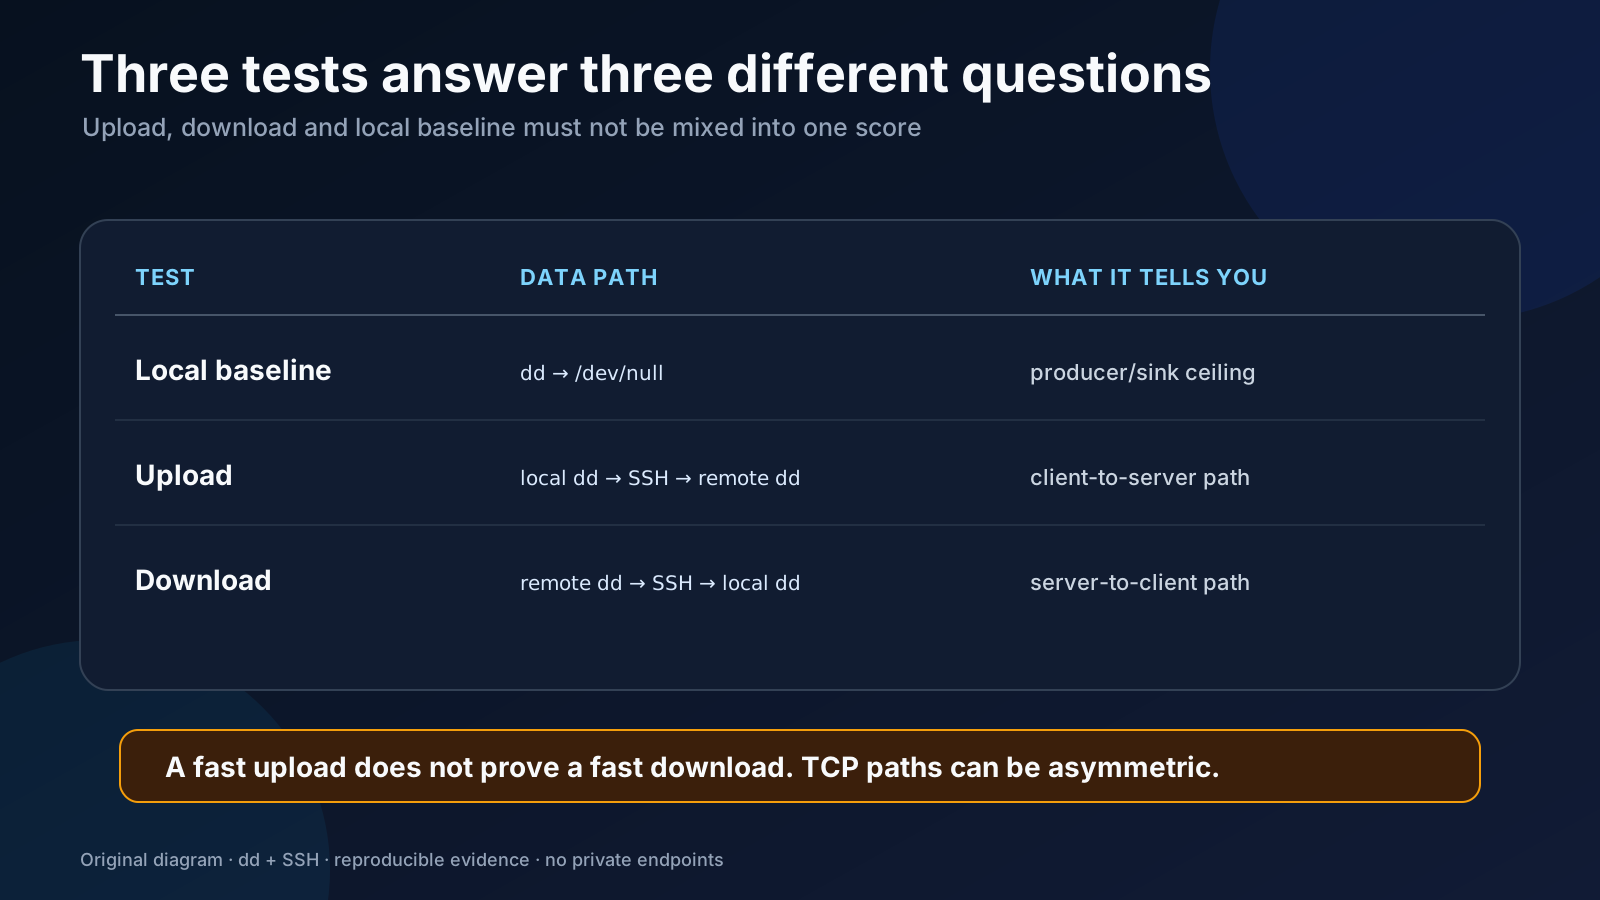
Figure 4: Original diagram. A fast upload does not prove a fast download.
| Test | Data path | Question answered |
|---|---|---|
| Local baseline | dd → /dev/null |
Is the local producer/sink the bottleneck? |
| Upload | local dd → SSH → remote dd |
What is the client-to-server path like? |
| Download | remote dd → SSH → local dd |
What is the server-to-client path like? |
Keep units honest
This article uses MiB (2²⁰ bytes) because bs=1048576 is explicit. Network equipment often reports decimal Mbps (10⁶ bits/s). Convert only after the measurement: MiB/s × 8 gives Mib/s, and then you can convert to decimal Mbps if needed. Never label 100 MiB/s as 100 Mbps.
Fixed payload, five to ten rounds
One round cannot distinguish a transient queue from a persistent pattern. Start with 16 or 32 MiB for five rounds; increase to 64 or 128 MiB only when the link owner approves the traffic. The approximate budget is:
traffic ≈ payload × rounds × directions
For 32 MiB × 5 × 2, that is about 320 MiB before SSH overhead. A stability test should not become a traffic incident.
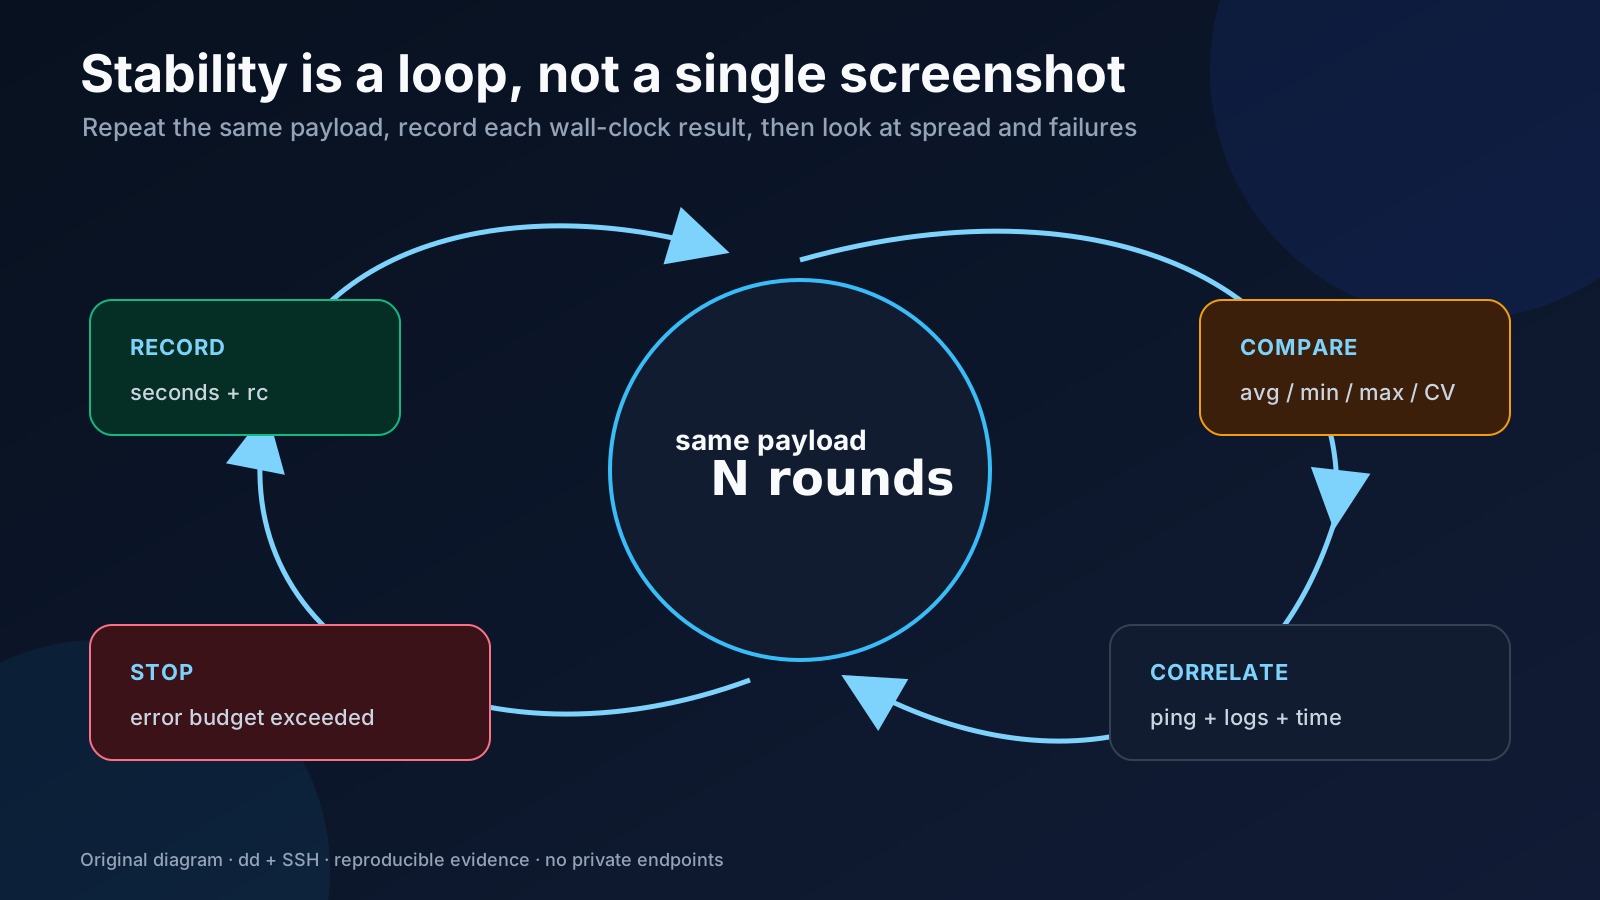
Figure 5: Original diagram. Stability is the shape of the sample set, not the last green line.
4. Run one test by hand, with no disk writes
Check the remote endpoint first
The remote side needs a POSIX shell, dd, and /dev/null. Do a read-only check before sending bytes:
ssh -T -o BatchMode=yes -o Compression=no \
  testuser@test-endpoint \
  'command -v dd && command -v sh'
Verify the host fingerprint on the first connection. testuser@test-endpoint is a placeholder; no real address, machine name, or credential belongs in a public article.
Upload: local producer, remote sink
/usr/bin/time -p sh -c \
  'dd iflag=fullblock if=/dev/zero bs=1048576 count=64 2>/dev/null |
   ssh -T -o BatchMode=yes -o Compression=no \
     testuser@test-endpoint \
     "dd iflag=fullblock of=/dev/null bs=1048576 count=64 2>/dev/null" \
   >/dev/null'
time prints real, the wall-clock duration. With a 1 MiB block, rough throughput is 64 ÷ real MiB/s. If the pipeline exits non-zero, inspect SSH stderr; do not rewrite a connectivity failure as “0 MiB/s.”
Download: remote producer, local sink
/usr/bin/time -p sh -c \
  'ssh -T -o BatchMode=yes -o Compression=no \
     testuser@test-endpoint \
     "dd iflag=fullblock if=/dev/zero bs=1048576 count=64 2>/dev/null" |
   dd iflag=fullblock of=/dev/null bs=1048576 count=64 2>/dev/null'
Run the two directions separately. Wi-Fi power saving, VPN policy, cloud shaping, and routing can make them asymmetric.
A minimal repeat loop
If you do not want the full scripts yet, this Bash fragment is enough to establish a five-round upload sample. pipefail preserves an error from either side:
set -o pipefail
for round in 1 2 3 4 5; do
  start=$(perl -MTime::HiRes=time -e 'printf "%.6f", time')
  dd iflag=fullblock if=/dev/zero bs=1048576 count=32 2>/dev/null |
    ssh -T -o BatchMode=yes -o Compression=no \
      testuser@test-endpoint \
      'dd iflag=fullblock of=/dev/null bs=1048576 count=32 2>/dev/null' \
    >/dev/null
  rc=$?
  end=$(perl -MTime::HiRes=time -e 'printf "%.6f", time')
  seconds=$(awk -v s="$start" -v e="$end" 'BEGIN { print e-s }')
  rate=$(awk -v s="$seconds" 'BEGIN { print 32/s }')
  printf 'upload round=%d rc=%d seconds=%.3f MiB/s=%.1f\n' \
    "$round" "$rc" "$seconds" "$rate"
done
5. A real lab run: a good average can hide upload variance
I ran an authorized isolated SSH path with a 32 MiB payload, five rounds in each direction. Addresses, usernames, and machine details were removed from the screenshots. Compression was disabled and both ends used /dev/null, so this is neither a disk benchmark nor an Internet SLA.
Local baseline: the producer is not the bottleneck
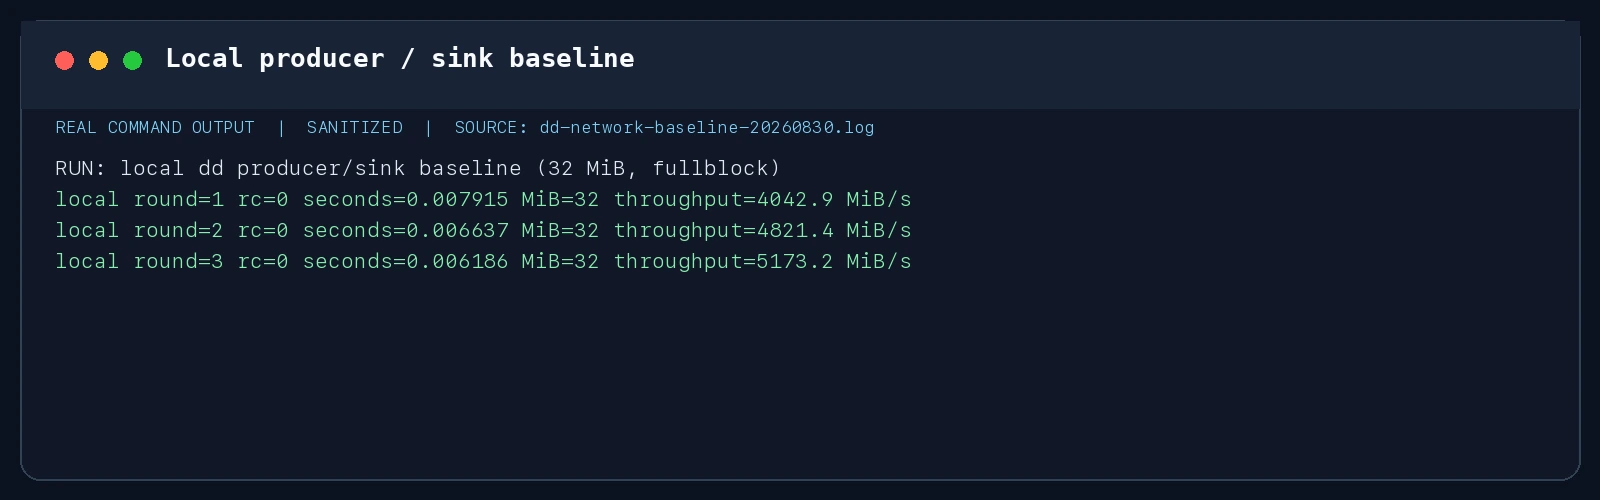
Figure 6: Sanitized real terminal output. The local baseline was about 4,043–5,173 MiB/s, far above the SSH path; this run was dominated by transport and encryption.
Upload: 38.0 MiB/s average, 16.7% CV
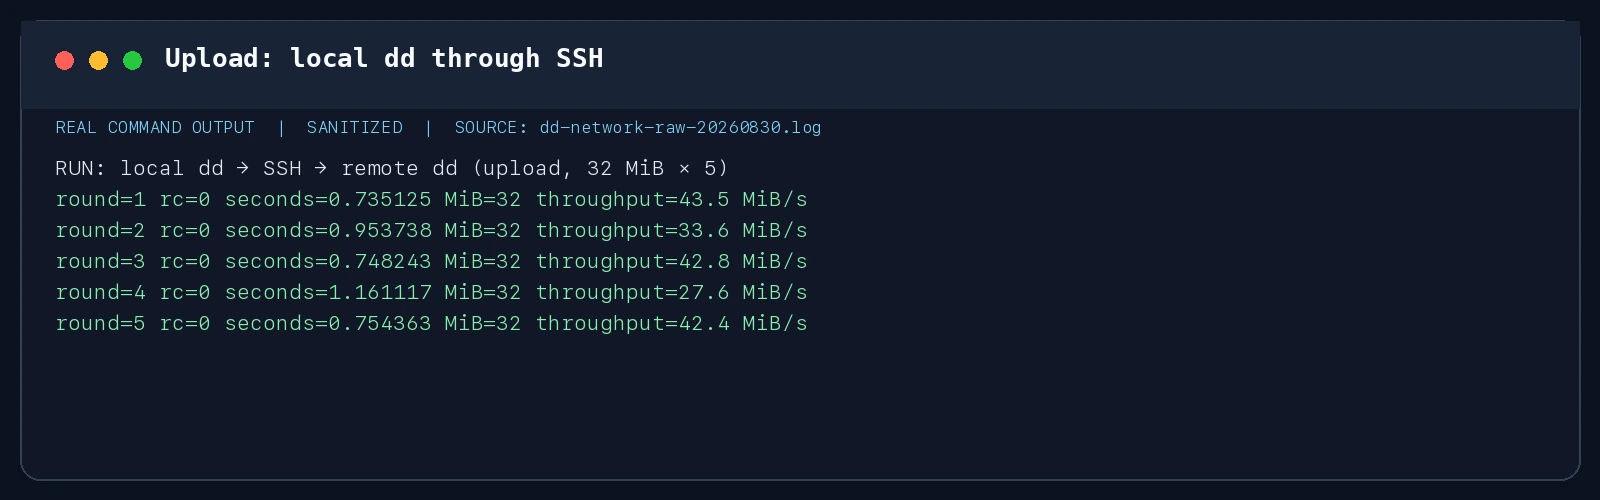
Figure 7: Sanitized real terminal output. The five rates were 43.5, 33.6, 42.8, 27.6, and 42.4 MiB/s. The slowest was about 36.6% below the fastest.
Download: 68.9 MiB/s average, 4.7% CV
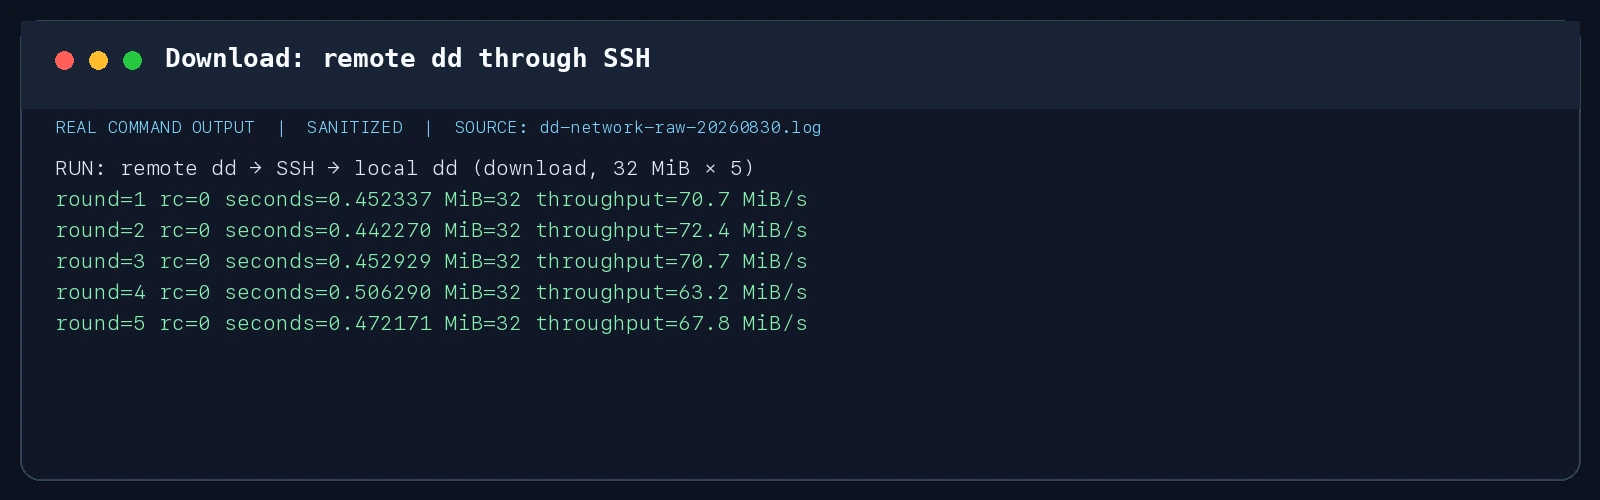
Figure 8: Sanitized real terminal output. The five rates were 70.7, 72.4, 70.7, 63.2, and 67.8 MiB/s. This sample was more stable in the download direction.
Summary: zero failures is not zero tail latency
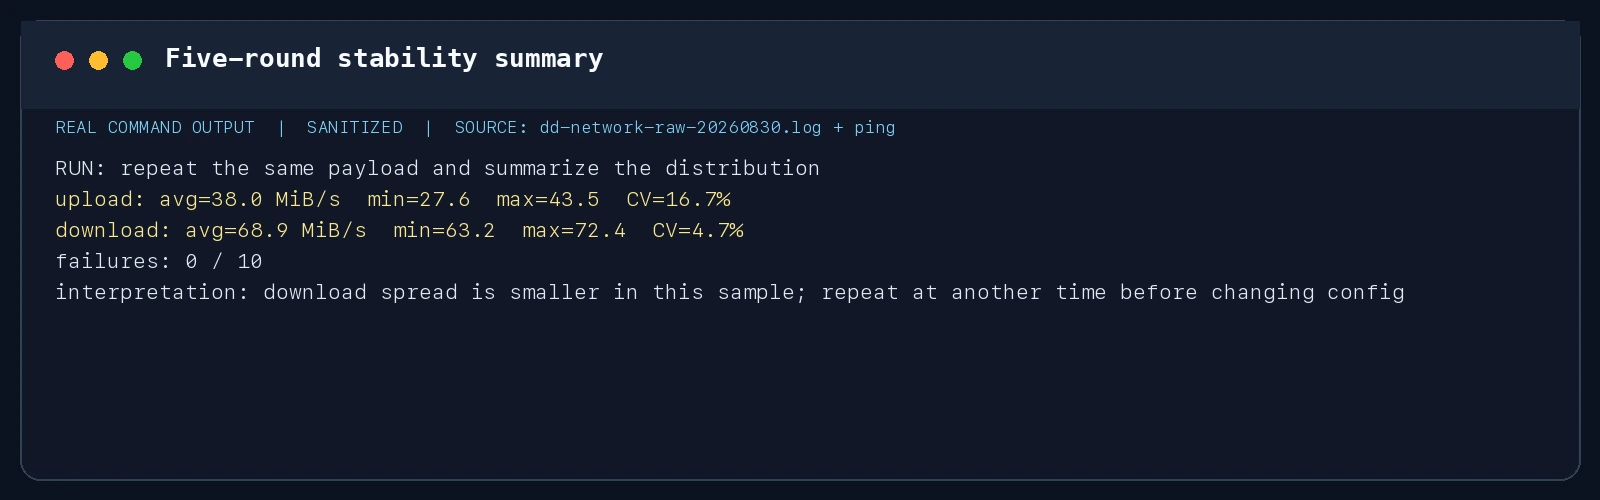
Figure 9: Sanitized real terminal output. All ten transfers succeeded, but upload CV was higher. It is one time window, not a capacity promise.
Five ICMP probes in the same lab had 0% packet loss and an average RTT around 104 ms, yet one response jumped to roughly 519 ms. That combination matters: no packet loss does not mean no queueing tail. Remote shells, voice, and Agent first-token latency often feel that tail before a ping command reports loss.
6. How to read the result: split “is it fast?” into four questions
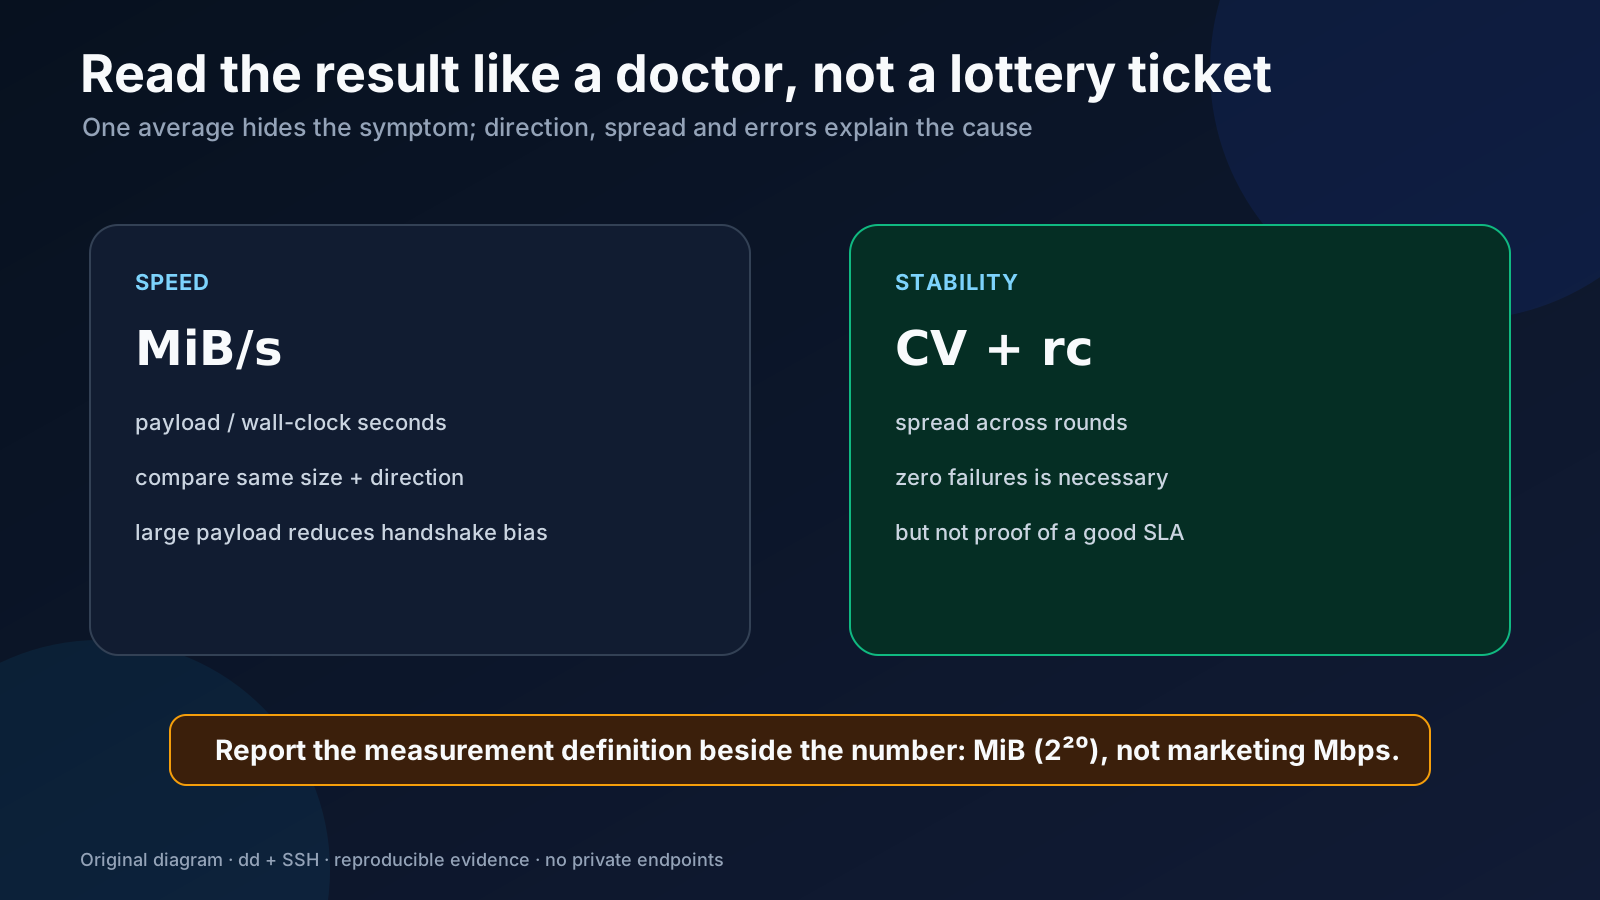
Figure 10: Original diagram. Read a network result like a medical report: direction, spread, and errors matter alongside the average.
- Throughput:
payload / wall-clock seconds. Compare the same payload and direction first. - Spread: report minimum, maximum, average, and CV (standard deviation ÷ average). A high CV says “this sample is variable,” not why.
- Reliability: preserve each exit code, SSH stderr, and early termination.
rc=0is necessary, not sufficient. - Tail experience: align ping P95/P99, SSH setup time, and application first-token latency on the same timeline.
Likely causes and next checks
- Small payload is slow, large payload improves: handshake and process startup dominate. Increase the payload or use a persistent connection for sustained throughput.
- Large upload/download gap: inspect route asymmetry, VPN egress, QoS, Wi-Fi power behavior, and cloud shaping.
- High spread with no failures: correlate queueing, congestion, CPU steal, cipher choice, and concurrent traffic before tuning TCP buffers.
Connection refusedor timeout: check port, service, and firewall first. The error is evidence, not a bandwidth number.- A tiny byte count with an amazing rate: suspect short reads and a missing
iflag=fullblock.
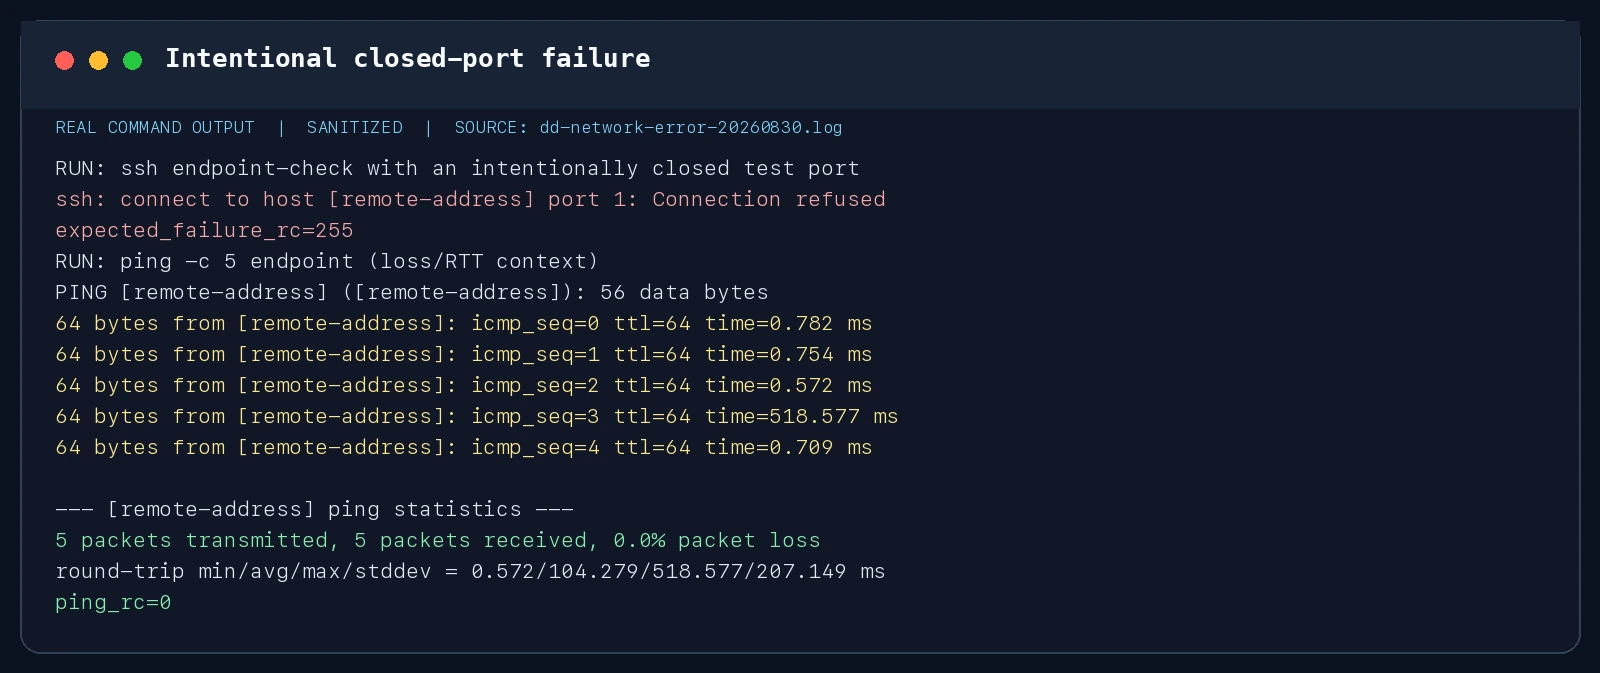
Figure 11: Sanitized real terminal output. Keep the failure category; do not silently convert it to 0 MiB/s.
7. Safety boundaries: the dangerous dd test is the one that fills a disk
/dev/null is not a test file
For a network baseline, bytes do not need to persist. Do not change the remote sink to a working-directory file, and do not add conv=fsync to a network test. That would mix network, filesystem, cache, and disk behavior, and it can exhaust storage. If you need a network-plus-disk experiment, design a separate bounded test with a cleanup plan and a maintenance window.
Four guardrails
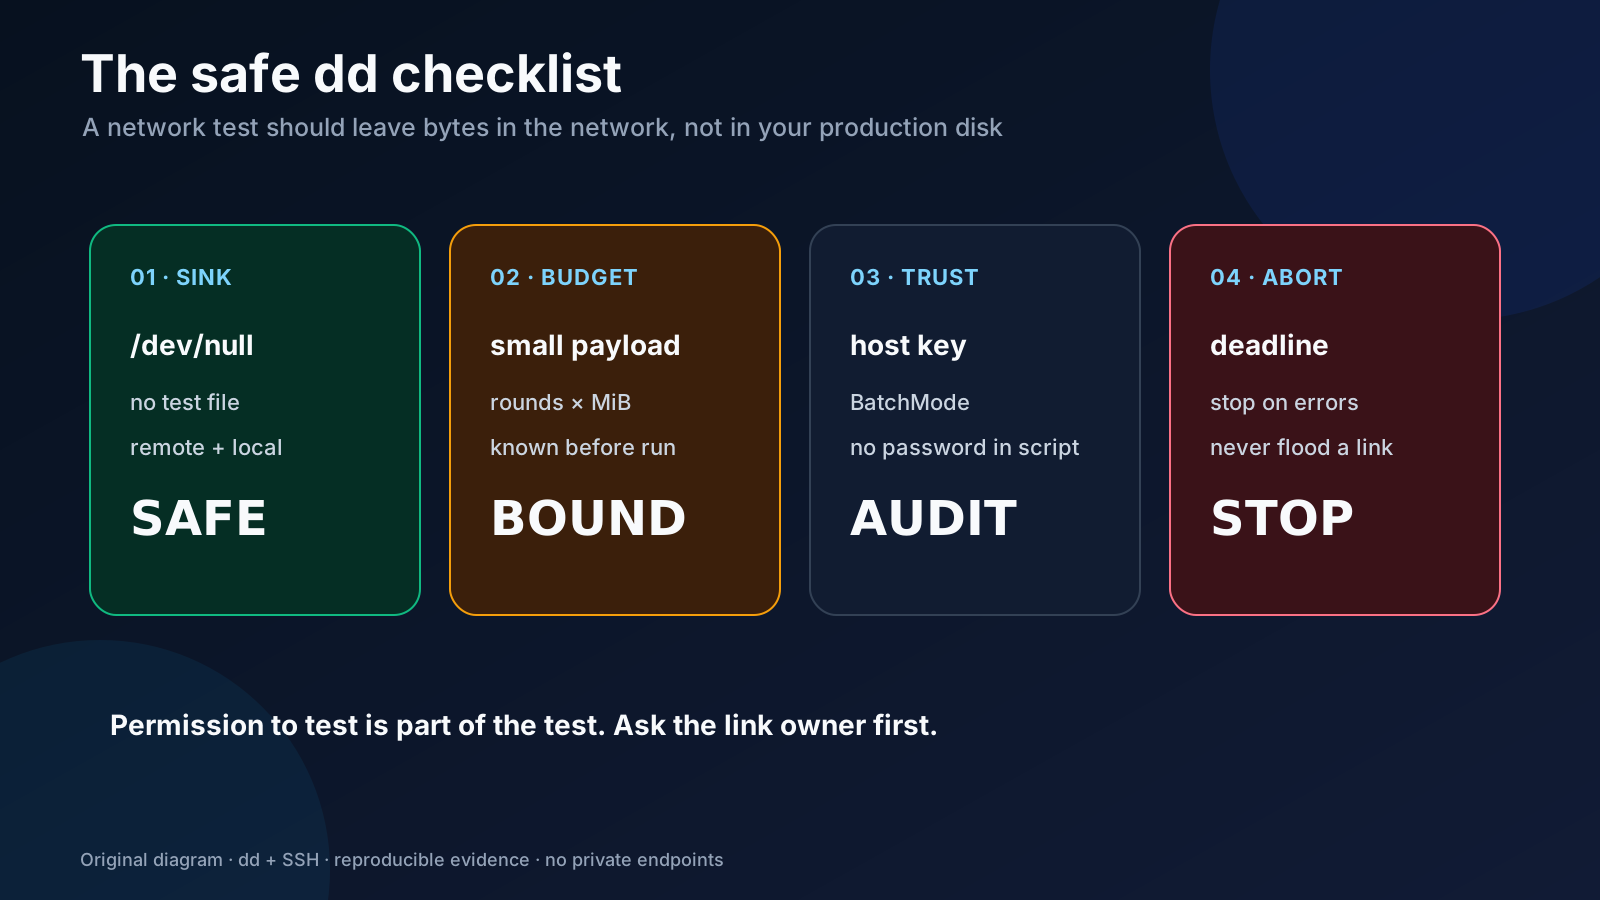
Figure 12: Original diagram. Ask who authorized the test, how much traffic it can create, and how it will stop before running it.
- Get permission: test only endpoints you own or are explicitly authorized to use.
- Bound traffic: cap payload and rounds; run the dry-run plan first.
- Keep SSH safe: use keys and
BatchMode=yes; never embed passwords, private keys, or jump-host credentials. Review the fingerprint after first-use acceptance. - Make it stoppable: keep connection timeouts and keepalives; stop when the link becomes abnormal instead of adding concurrency.
8. One-click scripts for three platforms
The complete scripts are included as downloadable files:
- Ubuntu 26.04: dd-network-test-ubuntu2604.sh
- macOS 26: dd-network-test-macos26.zsh
- Windows 11: dd-network-test-windows11.ps1
All three behave the same: 16 MiB by default, five rounds per direction, /dev/null at both ends, iflag=fullblock, per-round seconds/rate/exit code, and a final CV. Any failed round produces a non-zero script exit code.
Ubuntu 26.04
chmod +x dd-network-test-ubuntu2604.sh
./dd-network-test-ubuntu2604.sh \
  --remote-host test-endpoint \
  --remote-user testuser \
  --size-mib 32 --rounds 5 --direction both
Preview the plan without sending bytes:
./dd-network-test-ubuntu2604.sh --remote-host test-endpoint --dry-run
The script uses only the installed bash, dd, ssh, awk, and a standard Perl/Python clock fallback. It does not call a speed-test API.
macOS 26
chmod +x dd-network-test-macos26.zsh
./dd-network-test-macos26.zsh \
  --remote-host test-endpoint \
  --remote-user testuser \
  --size-mib 32 --rounds 5 --direction both
The macOS version uses system zsh and OpenSSH; WSL is not required. If an old BSD dd rejects iflag=fullblock, upgrade or use an audited compatible coreutils build. Do not simply remove the flag and treat short reads as complete blocks.
Windows 11
Windows does not provide /dev/zero, so the PowerShell version uses .NET to generate zero bytes and writes them to the inbox ssh.exe standard input. The remote side still runs dd; download bytes are read and discarded without a temporary file. WSL is not required.
Set-ExecutionPolicy -Scope Process Bypass
& .\dd-network-test-windows11.ps1 `
  -RemoteHost test-endpoint `
  -RemoteUser testuser `
  -SizeMiB 32 -Rounds 5 -Direction both
If OpenSSH Client is missing, enable Microsoft’s optional feature. The script does not fetch an untrusted same-name dd.exe.
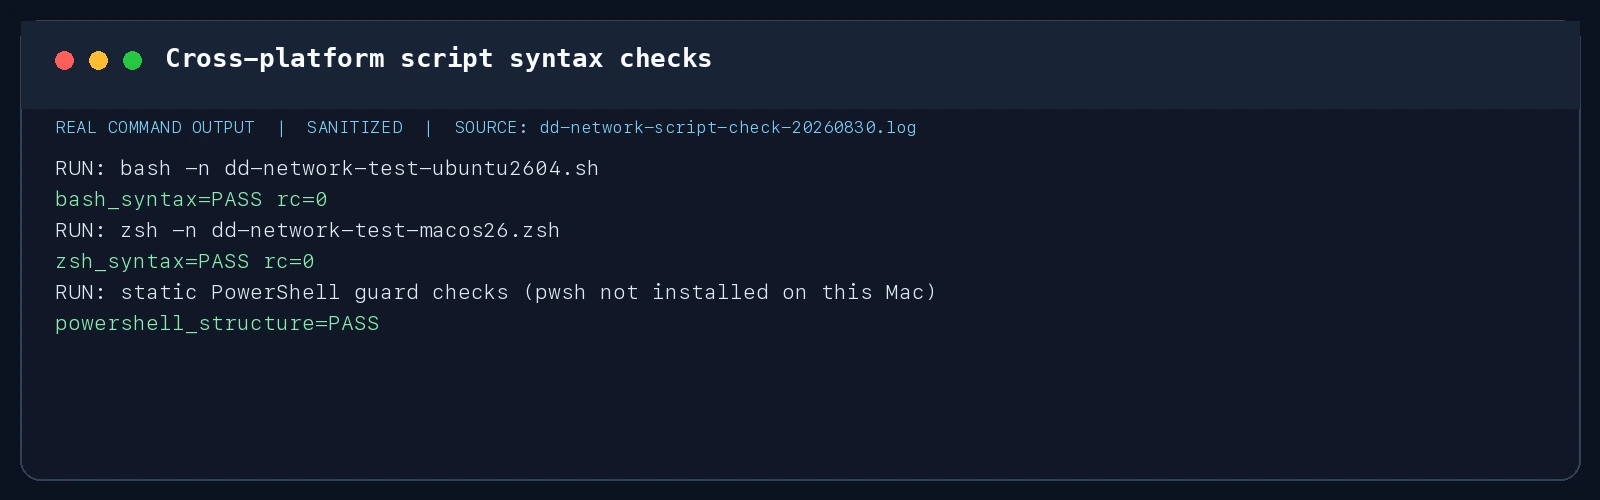
Figure 13: Sanitized real check output. The authoring machine is macOS, so PowerShell was structurally checked here; perform one small-payload run on Windows 11 for final validation.
9. Manual automation vs Agent-assisted configuration
Manual automation: dry-run first, then release traffic
- Download the platform script and inspect its contents and SHA-256.
- Fill in an endpoint, account, and SSH port that you are authorized to test.
- Run
--dry-runand confirm payload, rounds, directions, and worst-case traffic. - Verify the host fingerprint, then run the real test.
- Archive stdout, stderr, date/time zone, client/server versions, and relevant network changes as a baseline.
The first manual run builds intuition about what “normal” looks like. Redact addresses, usernames, paths, and credentials before sharing logs.
Agent-assisted configuration: give the Agent a bounded job
The following prompt works with an existing Codex, Claude Code, OpenClaw, or similar Agent. It tells the Agent to inventory, preview, and only then transmit bytes:
Build a dd + SSH network speed/stability baseline on this machine, but operate only on the endpoint I explicitly authorize.

Requirements:
1. Detect the OS and select dd-network-test-windows11.ps1, dd-network-test-ubuntu2604.sh, or dd-network-test-macos26.zsh.
2. Check ssh, dd, awk/PowerShell, print versions, and print the script SHA-256 before running it.
3. Use only the RemoteHost, RemoteUser, and Port I provide. Do not guess or scan other addresses.
4. Run the dry-run first, calculate payload × rounds × directions, and wait for my approval.
5. Use a small payload, BatchMode, Compression=no, iflag=fullblock, and /dev/null at both ends.
6. Record direction, seconds, MiB/s, exit code, and stderr per round. Stop on errors; never turn an error into 0 MiB/s.
7. Calculate avg/min/max/CV/failures and redact IPs, full host names, usernames, paths, and keys from the report.
8. Do not modify firewalls, SSH configuration, routes, kernel parameters, or install a third-party speed-test service.
9. Explain what was measured, what was not measured, and who must approve the next action. Do not call the result an SLA.
An Agent can repeat measurements and compare evidence, but it must not invent an endpoint, bypass fingerprint approval, or expand the traffic budget on its own.
10. Q&A
Q1: Does dd measure Internet bandwidth?
Only if the two endpoints and the path are yours or explicitly authorized. It measures the selected SSH path, not every route your applications might use.
Q2: Why is a browser test faster?
Browser tests often use multiple connections, a nearby server, and a specialized protocol. This lab uses one SSH stream and includes setup and encryption. They answer different questions.
Q3: Why is iflag=fullblock essential?
Pipe reads can be short. Without full-block reads, count counts read records rather than the intended byte volume, producing a falsely high rate.
Q4: Do I need root?
No. A least-privilege account that can run dd and access /dev/zero and /dev/null is preferable.
Q5: Why not install a dd.exe on Windows?
The script avoids an unreviewed binary. It uses the inbox OpenSSH client and .NET byte streams; only the remote Unix side runs dd.
Q6: Five successful rounds means the network is stable, right?
It means those five samples had no transfer failures. Check CV, RTT tails, both directions, and several time windows before making a stability claim.
Q7: Why start at 32 MiB instead of 1 GiB?
It reduces handshake bias without creating unnecessary traffic on a shared link. Increase gradually after authorization.
Q8: Can I write to a file and test the disk at the same time?
You can, but that is a different network-plus-storage experiment. Give it its own capacity limit and cleanup policy.
Q9: Why not use iperf3?
iperf3 is better for raw TCP/UDP capacity, concurrency, and packet loss. dd + SSH is widely available and resembles an actual SSH/file-transfer path. They complement each other.
Q10: Is Connection refused equal to zero bandwidth?
No. It usually means the port, service, or firewall rejected the connection. Preserve the error and fix reachability before discussing throughput.
11. Closing: turn “it feels slow” into evidence you can revisit
The useful part of dd is not the large number it can print. It forces precise questions: who produced the bytes, who consumed them, which direction, how much data, how long, what failed, and how widely the result moved. With two authorized endpoints, you can build a repeatable baseline without a third-party speed-test service.
Put the lab into your change process. Run a small payload before and after a VPN, route, cloud-size, or SSH-cipher change. Archive the raw log and a sanitized summary. When a remote shell or Agent becomes sluggish, repeat the same direction before changing MTU, congestion control, or application retries. Complete the evidence chain before tuning parameters.
References: GNU Coreutils dd manual, OpenBSD dd manual, OpenSSH ssh manual, Microsoft OpenSSH for Windows, Ubuntu dd manpage, and RFC 1122. Commands and measurements reflect the systems and isolated lab available at writing time; review them for your own platform and authorization boundary.