Stop Reading Logs by Hand: A Practical ELK-to-AI-Agent Guide from Deployment to Assisted Troubleshooting
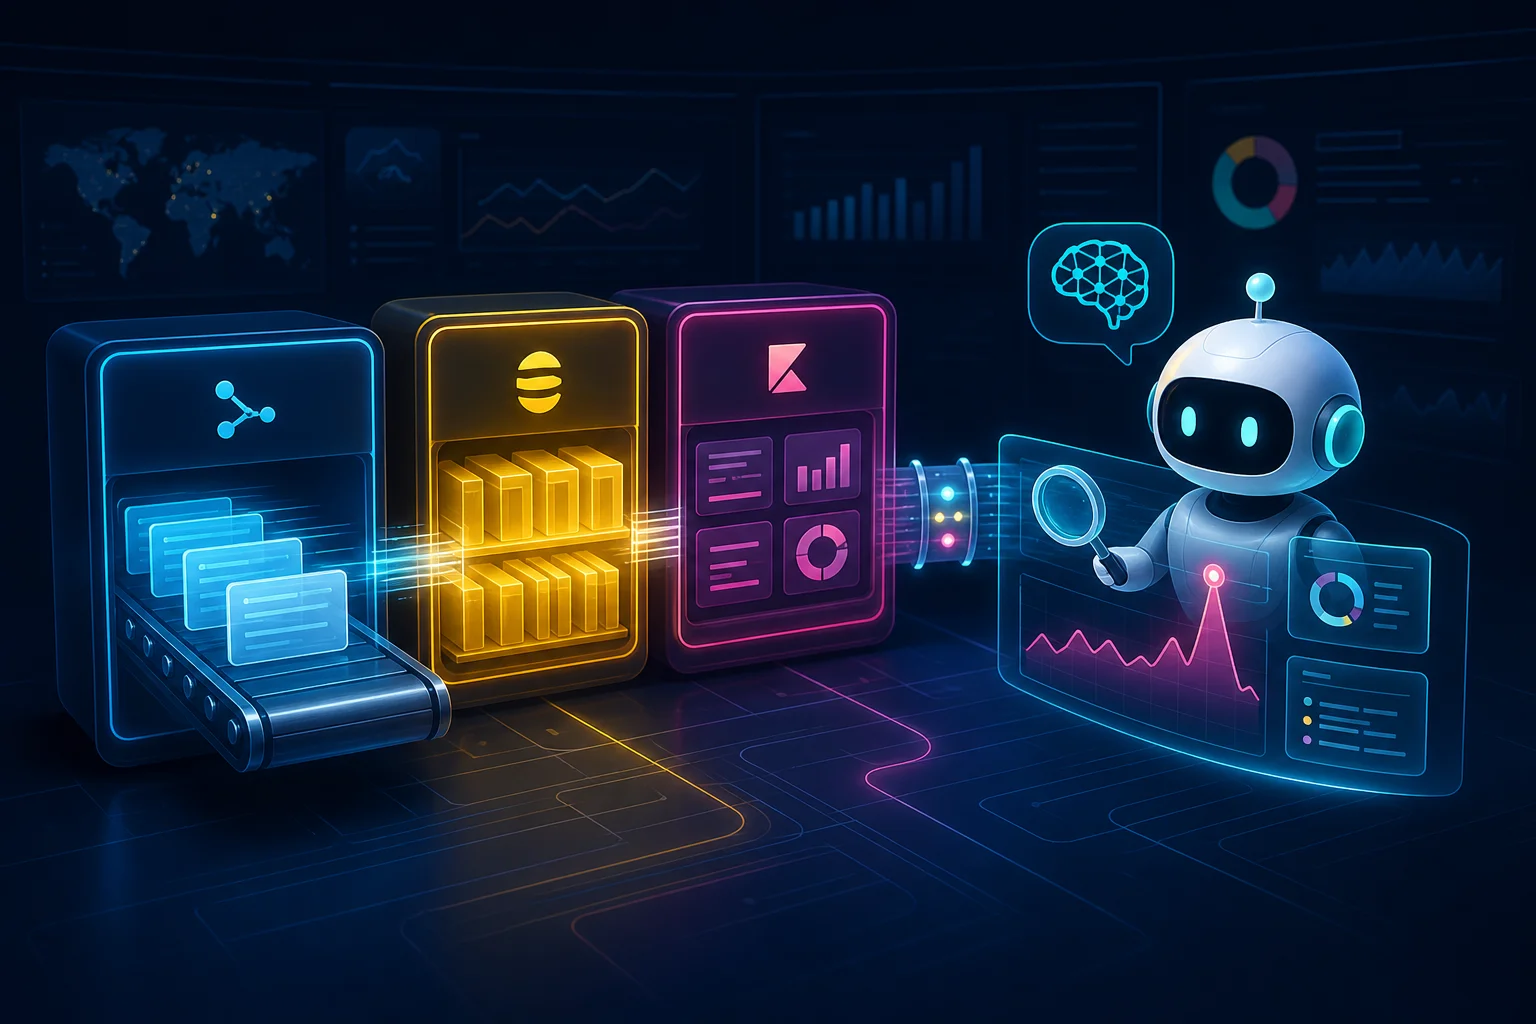
The traditional incident-response ritual is familiar: open Kibana, choose a time range, write a query, scan pages of logs, copy a few stack traces, and manually assemble a theory. Once several services are involved, the job feels like finding one screw in a warehouse with no clerk.
A better design keeps ELK responsible for dependable ingestion, normalization, search, and visualization, then adds an MCP bridge that lets an AI Agent retrieve evidence through tools. Instead of pasting a giant log file into a chat window, you can ask:
Which service produced the most 5xx responses during the last 15 minutes? Show the evidence, related trace IDs, and the next checks you recommend.
The Agent should not answer from intuition. It should call Elasticsearch, receive a bounded result, and explain what the data supports. For this article I ran Elasticsearch, Logstash, Kibana, and the Elasticsearch MCP Server, ingested sanitized synthetic incident logs, completed an MCP handshake, listed the available tools, and executed a real search. I also kept the Logstash permission failure encountered during the first run because it is exactly the kind of practical detail tutorials often hide.
The important idea: do not let AI “read everything”; let it query safely
A useful architecture assigns one clear job to each component:
- Logstash receives, parses, enriches, and sanitizes events.
- Elasticsearch indexes, searches, aggregates, and stores them.
- Kibana remains the human dashboard for exploration, verification, and audit.
- An MCP server exposes selected Elasticsearch capabilities as Agent tools.
- The AI Agent plans the investigation and summarizes evidence, but starts with no delete or write authority.
This is fundamentally different from sending all production logs to a chatbot. The data stays in your own stack, and the model receives only the fields and samples needed for the current question.
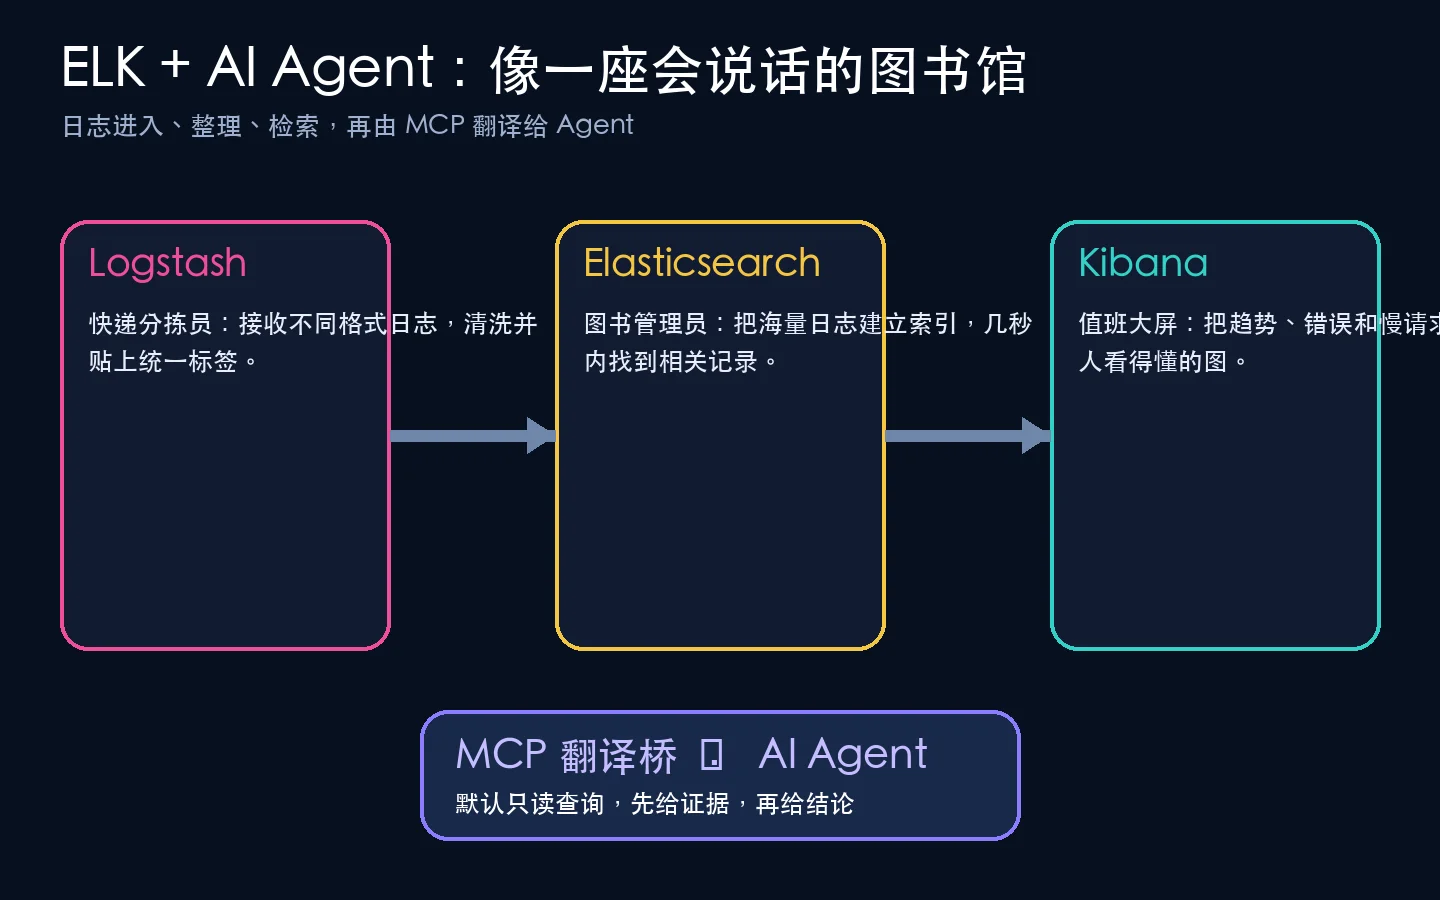
A child-friendly analogy is a library. Logstash is the worker who receives books and adds labels. Elasticsearch is the librarian who remembers where every topic appears. Kibana is the large search screen used by visitors. MCP is a translator. The AI Agent is the helpful duty assistant. When asked which accident happened most often, the assistant does not guess; it asks the translator to query the librarian and returns both the answer and the relevant shelf locations.
What the ELK trio actually does
Elasticsearch: a search and analytics engine
Elasticsearch stores JSON documents and builds indexes optimized for full-text search, time filtering, structured conditions, and aggregations. A log event normally contains a timestamp, service, severity, message, status code, latency, and trace identifier.
Think of an inverted index as the index at the back of an enormous book: instead of reading every page, the system maintains a map from terms to locations. That is why it can quickly answer questions such as “How many 504 responses did the payment service emit during the last ten minutes?” even when the log volume is very large.
Logstash: the sorting line
A Logstash pipeline is built from input, filter, and output stages. It can read files, sockets, queues, and many other sources; parse unstructured messages; normalize timestamps; remove confidential fields; and deliver clean events to Elasticsearch.
Agent quality depends heavily on this stage. If everything remains buried in one long message string, the Agent can only perform fuzzy searches. If the pipeline extracts service, level, status_code, duration_ms, and trace_id, the Agent can calculate accurate counts, compare services, and connect related events.
Kibana: the cockpit humans still need
Kibana provides Discover, dashboards, ES|QL, index management, and alerting. Adding an Agent does not make Kibana obsolete. Kibana is how an operator verifies the Agent’s conclusion. If the Agent claims that errors are concentrated in one service, the same filter should produce the same evidence in Discover.
Why many “logs plus LLM” experiments disappoint
The first failure mode is pasting hundreds of kilobytes into a prompt. Repeated metadata and irrelevant INFO lines consume context while the critical event becomes harder to notice.
The second is relying only on vector search. Semantic similarity is useful for finding conceptually related incident notes, but exact conditions such as “status equals 504,” “during the last 15 minutes,” or “group by service” are better handled by structured filters, Query DSL, aggregations, or ES|QL. Good log analysis uses the right retrieval method for each question.
The third is giving the Agent an Elasticsearch superuser. An investigation assistant usually needs read and metadata privileges, not the ability to delete an index or replace a template.
The fourth is producing an answer without a chain of evidence. “It may be the connection pool” is not enough. A defensible response states the time range, index, query conditions, hit count, representative events, and uncertainty.
The hands-on experiment
The lab used Elastic 9.2.3 containers. Every exposed port was bound to the loopback interface, and all events were fictional. The sample incident represented a checkout system in which the payment component produced gateway timeouts and a connection-pool exhaustion error.
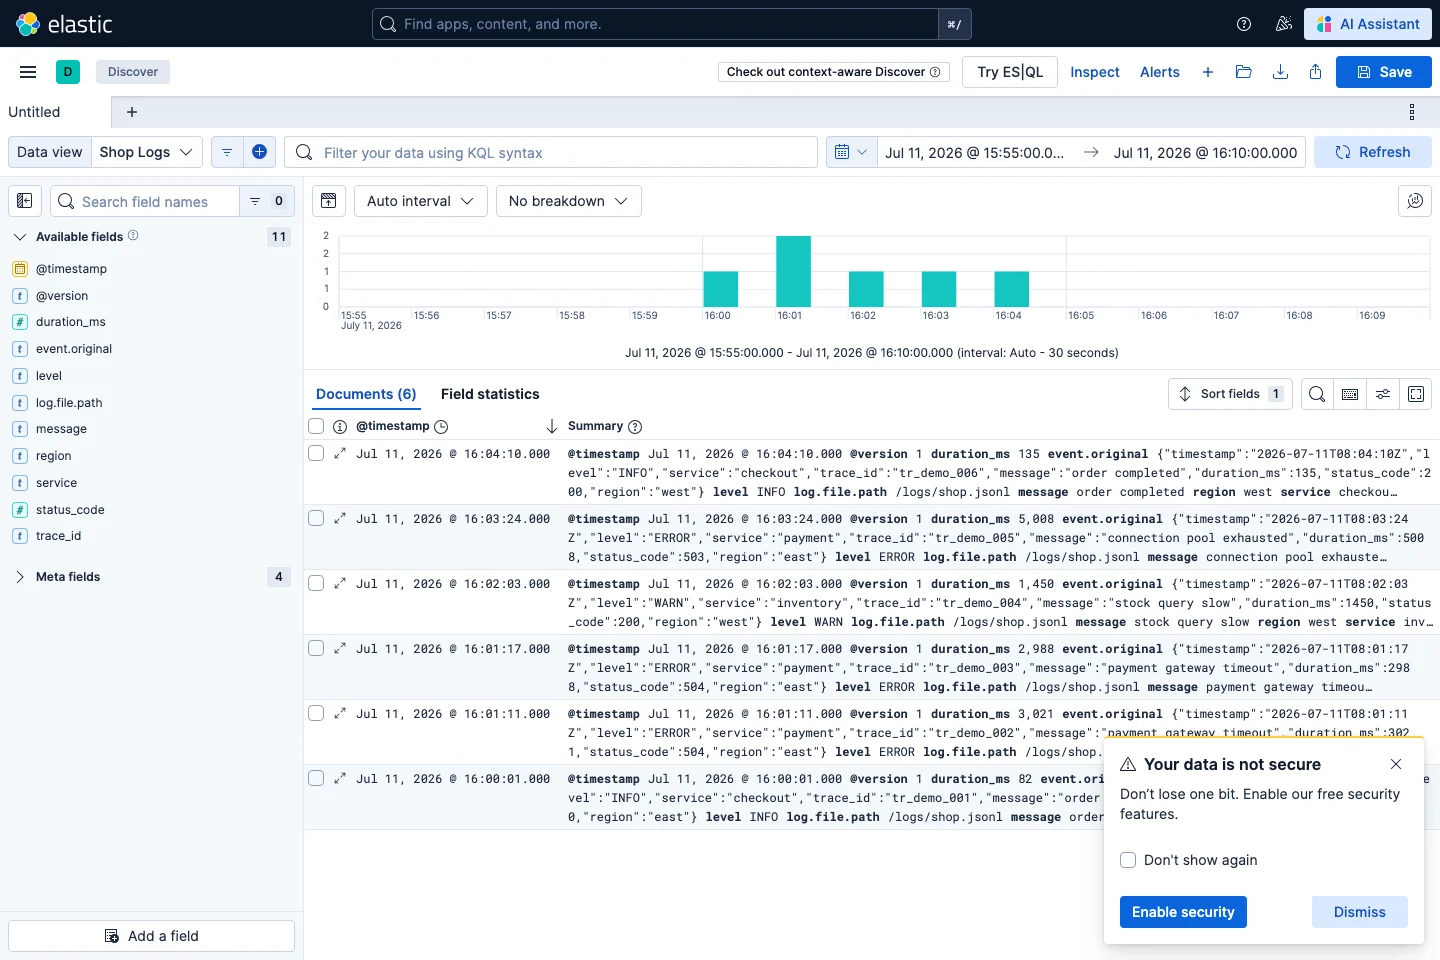
Logstash read a JSONL file and indexed six events into shop-logs. Three of them had an ERROR level. A Kibana data view made the same events visible to a human operator.
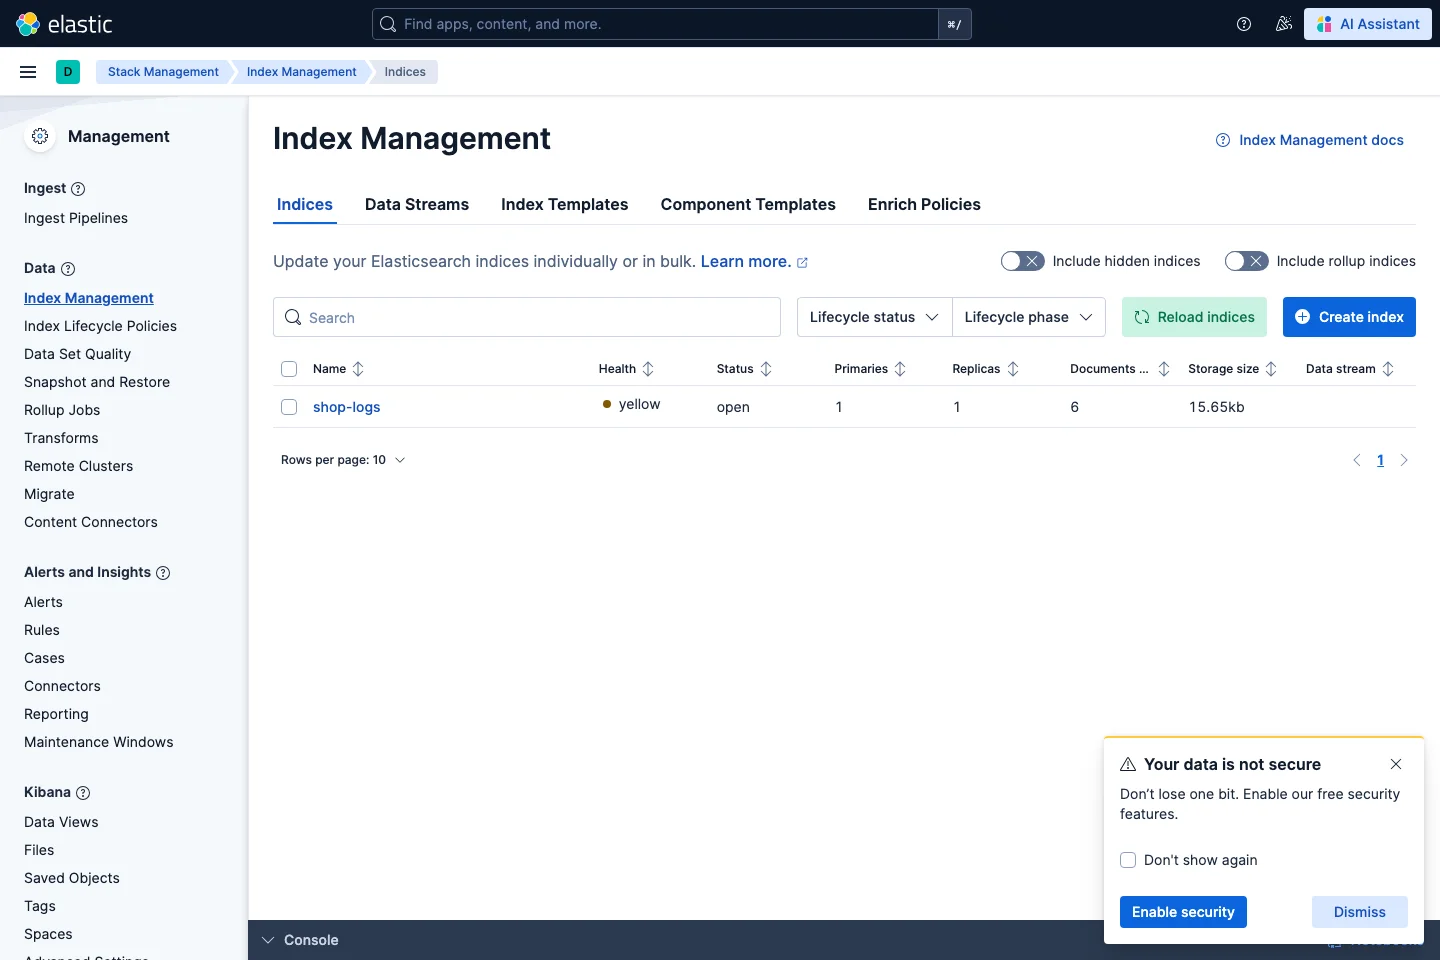
Index Management showed one index and six documents. The yellow status is expected in this single-node demonstration because the default replica cannot be assigned. It does not mean the primary shard is unavailable. Production clusters need proper multi-node and replica planning.
The standalone Elasticsearch MCP Server then exposed Streamable HTTP and SSE endpoints. Its own startup log warned that this server is deprecated except for critical security maintenance and that Elastic 9.2+ users should prefer the MCP server built into Agent Builder. The standalone server remains educational because it makes the bridge easy to inspect, but a new production project should evaluate Agent Builder first.

The MCP tools/list response included get_mappings, esql, get_shards, search, and list_indices. A real search call filtered ERROR events and sorted them by latency. It returned three results: the longest request took 5008 ms, every error came from the payment service, and the status codes were 503 or 504.
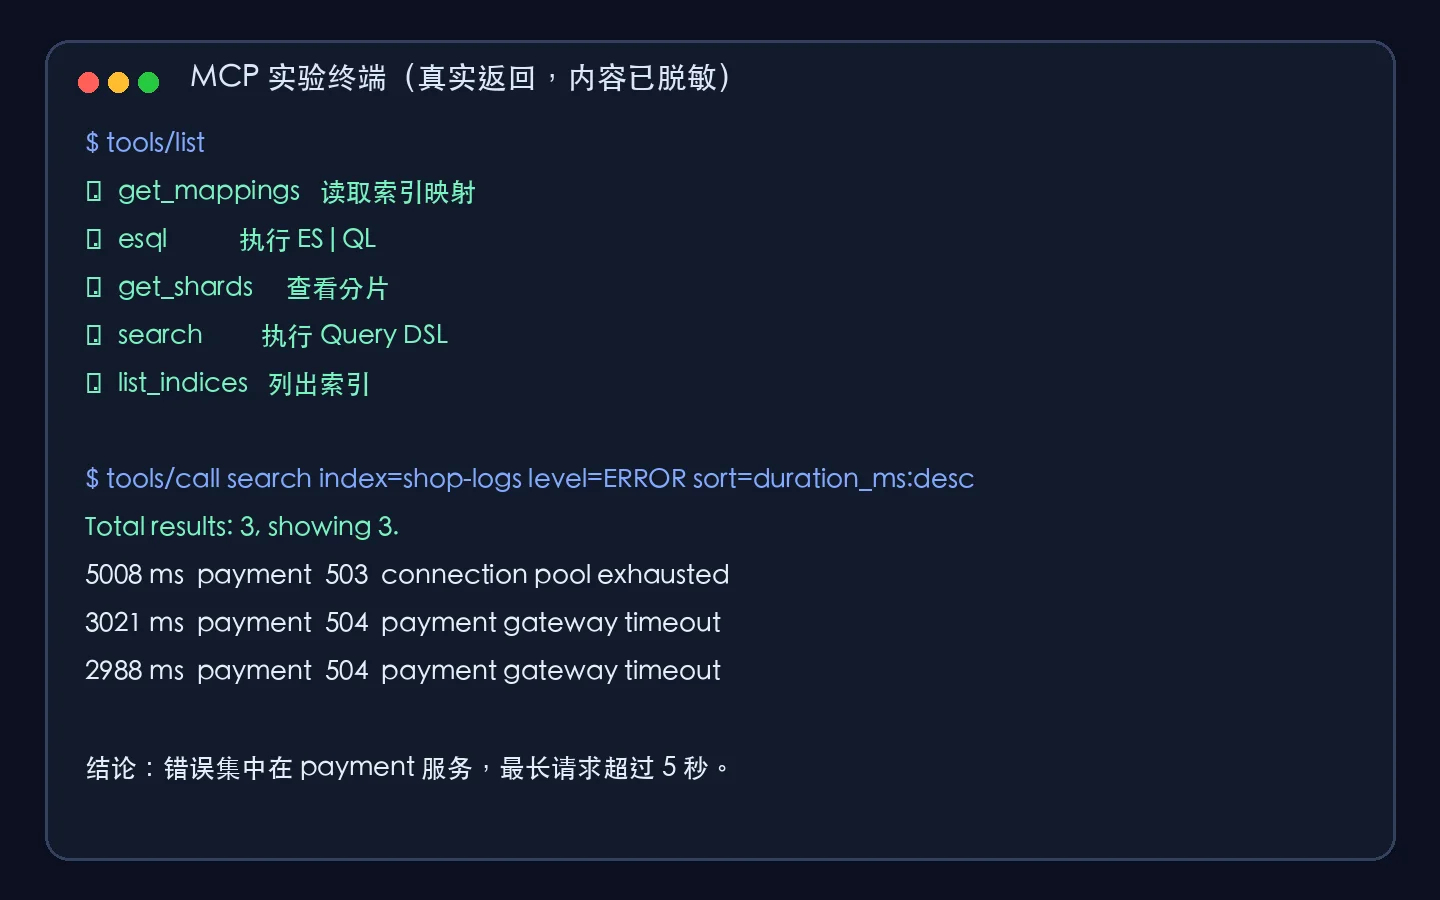
Only after receiving that evidence should an Agent say that the incident is concentrated in the payment path, with gateway timeout and connection-pool exhaustion messages, and recommend checking pool utilization, upstream latency, and neighboring events sharing the same trace IDs. This is still a prioritized hypothesis, not an automatic declaration that the root cause has been proven beyond doubt.
What happens behind one natural-language question
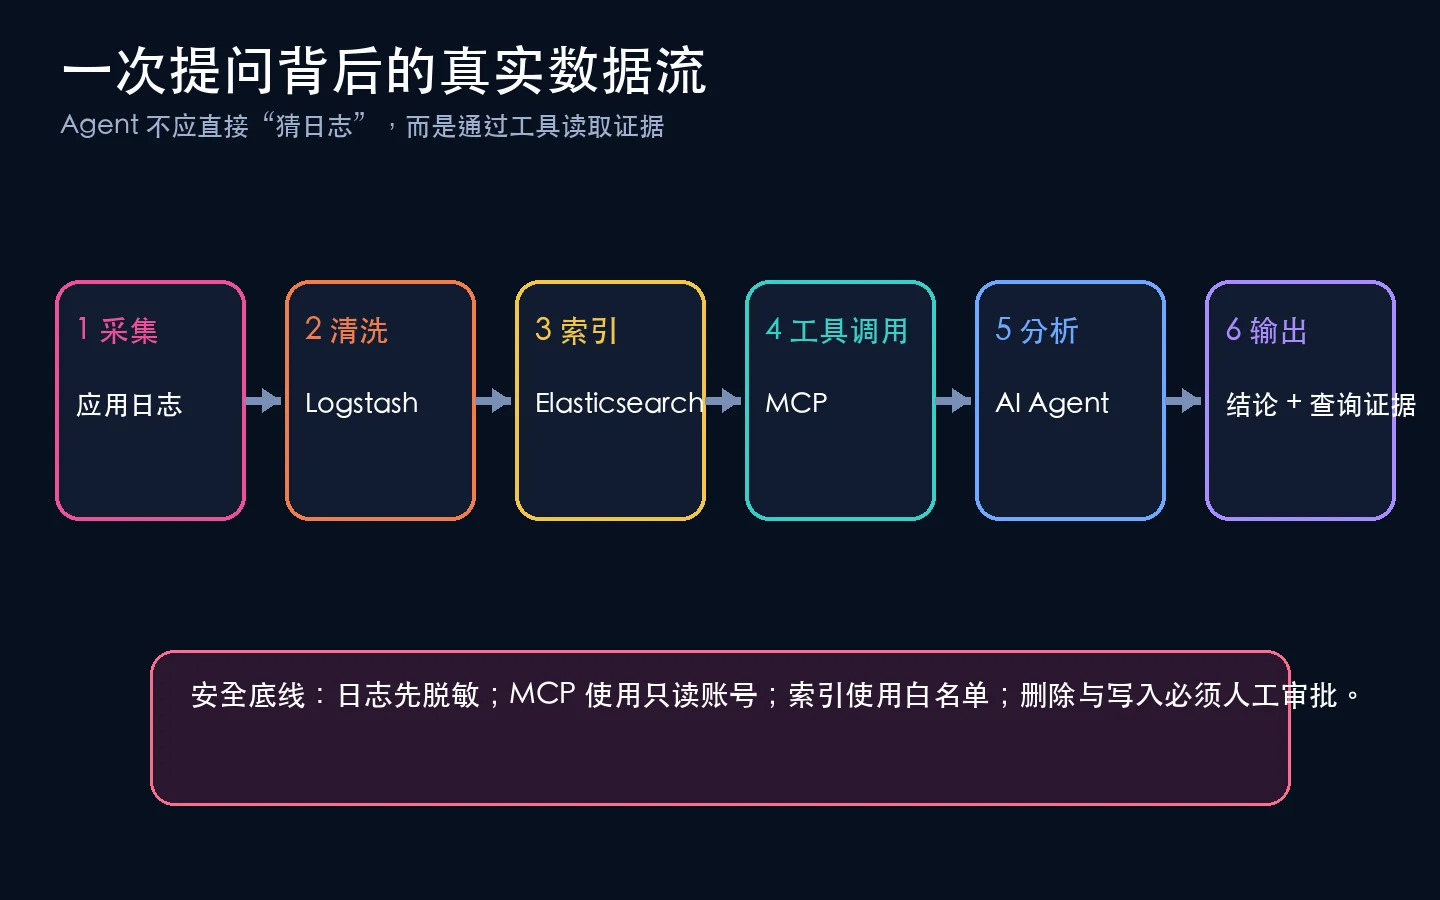
The flow contains six steps: an application emits logs; Logstash cleans and structures them; Elasticsearch indexes them; the Agent selects an MCP tool; MCP performs a restricted query; and the Agent turns the response into an explanation, table, or investigation checklist.
MCP itself is not a model or a database. It is closer to a USB-C specification: when an Agent and a tool agree on how capabilities are listed, how arguments are sent, and how results are returned, each Agent no longer needs a completely custom Elasticsearch plugin.
One-click installers for three operating systems
The following scripts use local Docker only. They require no hosted log platform, SaaS vector database, or external AI service. Each script starts Elasticsearch, Logstash, Kibana, and the MCP server, creates sanitized sample events, and writes a generic mcp.json file.
Run the Windows script in an elevated PowerShell session:
Set-ExecutionPolicy -Scope Process Bypass
.\install-windows-11.ps1
Run the Ubuntu version with:
chmod +x install-ubuntu-26.04.sh
./install-ubuntu-26.04.sh
Run the macOS version with:
chmod +x install-macos-26.sh
./install-macos-26.sh
The lab disables Elasticsearch authentication to keep the first exercise understandable. It must never be exposed to an untrusted network in that form. After startup, Kibana listens on local port 5601, and the Streamable HTTP MCP endpoint is available at local port 8080/mcp.
Human-triggered automation
In the first method, a human reviews and runs the installer while the script automates directory creation, configuration, container startup, and sample ingestion.
Verify the result with:
docker compose ps
curl http://localhost:9200/_cluster/health
curl http://localhost:8080/
Create an app-logs data view in Kibana and select @timestamp as the time field. After Discover shows the sample events, add the MCP URL to your Agent. Start with a read-only prompt:
List the fields available in app-logs, then query ERROR events.
Your answer must include the time range, conditions, hit count, and no more than three representative records.
Do not perform any write or delete operation.
Agent-driven configuration
An Agent that can use the terminal and edit files can perform the setup, but the prompt must define boundaries. The following instruction tells it to inspect the script, keep services local, back up existing configuration, preserve other MCP servers, and stop on failure.
Deploy the local ELK plus Elasticsearch MCP lab on this computer.
1. Choose the Windows 11, Ubuntu 26.04, or macOS 26 installer for the detected OS.
2. Review the script before execution and confirm every published port is bound to localhost.
3. Run it and wait for Elasticsearch, Kibana, and MCP health checks.
4. Read the generated mcp.json. Locate your own MCP configuration, create a timestamped backup, and add the elasticsearch server without overwriting other entries.
5. Do not store real secrets or enable write/delete permissions.
6. Validate tools/list and perform one read-only app-logs query.
7. Report changed files, backup paths, commands, and concise results. Stop immediately if any step fails.
The real failure encountered: Logstash was present but no index appeared
During the first run, Elasticsearch and Kibana became healthy, and the Logstash container existed, but shop-logs never appeared. The decisive evidence was in the container log:
Permission denied - /usr/share/logstash/pipeline/logstash.conf
The pipeline syntax and Elasticsearch network were not the problem. The uploaded host file had permissions that prevented the non-root Logstash user inside the container from reading it. The repair was simple:
chmod 644 pipeline/logstash.conf sample-logs/*.jsonl
docker compose up -d --force-recreate logstash
This is a useful operational lesson: a container existing—or briefly showing “running”—does not prove that its pipeline processed any event. A better verification sequence is container state, container logs, Logstash API, target index existence, and document count.
Production guardrails
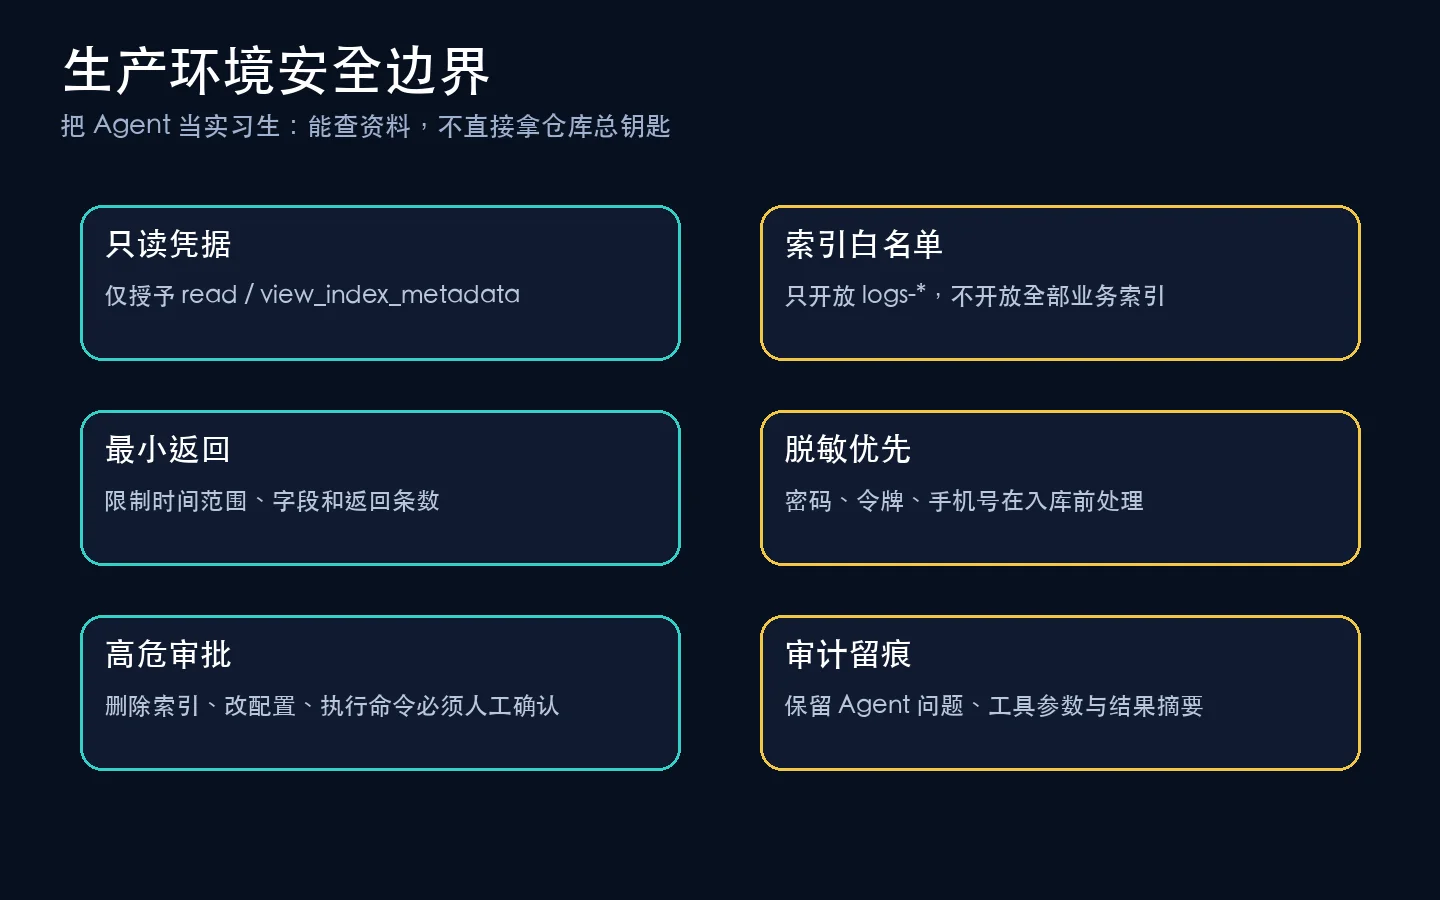
The demonstration trades security for clarity. A production implementation should enable TLS and Elastic security, create a dedicated MCP role with only read and view_index_metadata, restrict access to selected index patterns, sanitize secrets before ingestion, cap time ranges and result sizes, and audit every Agent question and tool call.
Treat text inside logs as untrusted data. An attacker may deliberately write a line that looks like an instruction to the Agent. That text must never override system policy. Delete operations, template changes, shell execution, and remediation actions should require explicit approval until a narrowly scoped workflow has been proven safe.
The easiest analogy is a new intern: give the intern a library card and a checklist, not the warehouse master key, the company seal, and the production root password.
Agent Builder or the standalone MCP server?
For Elastic 9.2 and later, the standalone server itself recommends Agent Builder’s integrated MCP server. A practical choice is:
- Prefer Agent Builder for a new project that wants centrally managed Agents, tools, and policies.
- Use the standalone server for a controlled compatibility lab with an existing external Agent, while accepting its maintenance status.
- Skip an Agent entirely when a fixed ES|QL query, dashboard, or alert already solves the problem more reliably.
AI is not automatically the best abstraction. If the workflow never changes, a deterministic query may be safer, cheaper, and easier to audit.
Q&A
Can the Agent repair incidents automatically?
It can eventually call ticketing, orchestration, or execution systems, but the recommended first milestone is read-only analysis with cited evidence and human approval. Add low-risk actions gradually after the query and audit layers are dependable.
Is a vector database required?
No. Exact status codes, services, timestamps, and latency thresholds are better served by structured Elasticsearch queries. Semantic or hybrid retrieval is useful for matching an event to similar historical incident notes, not as a replacement for every filter and aggregation.
Will large logs consume huge model contexts?
A correct integration filters and aggregates in Elasticsearch first. MCP returns a small set of fields, counts, and representative samples. The raw data set should not be copied wholesale into the model context.
Why are the screenshots based on fictional logs?
Production logs frequently contain credentials, internal addresses, customer data, and proprietary identifiers. Synthetic events preserve the technical experiment without leaking those details into an article or Git repository.
Final takeaway
Connecting ELK to an AI Agent is not about replacing the logging platform. It adds a standardized, permissioned, auditable reasoning layer above a mature data pipeline. Logstash structures the evidence, Elasticsearch retrieves it, Kibana keeps humans in control, MCP provides the tool interface, and the Agent translates a question into queries and an evidence-based explanation.
The reliable order is always the same: structure logs before adding AI, grant read access before actions, verify evidence before accepting conclusions, and establish security boundaries before pursuing full automation. With those foundations, the Agent becomes more than a fluent chatbot: it becomes an assistant that knows where it looked, what it found, and why its answer follows from the data.