Stop Letting AI Guess: Connect MySQL, Prometheus, Loki and Grafana to an Agent, Step by Step

Many teams already run MySQL, Prometheus, Loki and Grafana. Yet when an alert fires, the on-call engineer still jumps between four windows: inspect a dashboard, write a PromQL query, search logs for a trace ID, and finally connect to the database to confirm the business record.
It is like a hospital that owns a thermometer, medical records, laboratory reports and a monitoring wall, while the doctor still has to visit four rooms and copy every number by hand. The useful role of an AI Agent is not to guess the illness. It is to use tightly restricted tools, collect evidence from those systems and clearly separate symptoms, confirmed facts, likely causes and recommended actions.
This article is based on a real isolated lab. I started MySQL 8.4, Prometheus 3.13, mysqld_exporter 0.19, Loki 3.7 and Grafana 13.1, injected a synthetic slow-query incident with a shared sanitized trace_id, and then used a self-hosted read-only MCP bridge to perform protocol initialization, tool discovery, PromQL, LogQL, SQL and Grafana data-source auditing.
The short answer: connecting the stack does not mean giving AI four administrator passwords
A safe design keeps the responsibilities separate:
- MySQL remains the source of business facts, accessed through a dedicated read-only account.
- Prometheus stores numeric change over time, including connections, throughput and cache behavior.
- Loki stores event context and lets tools correlate logs by time, labels and trace IDs.
- Grafana remains the human cockpit for dashboards, exploration and verification.
- An MCP bridge exposes narrow operations instead of an unrestricted shell.
- The Agent gathers evidence before writing an answer and never presents model speculation as measured fact.
The Agent should receive keys that open a few approved drawers, not a master key for the whole building.
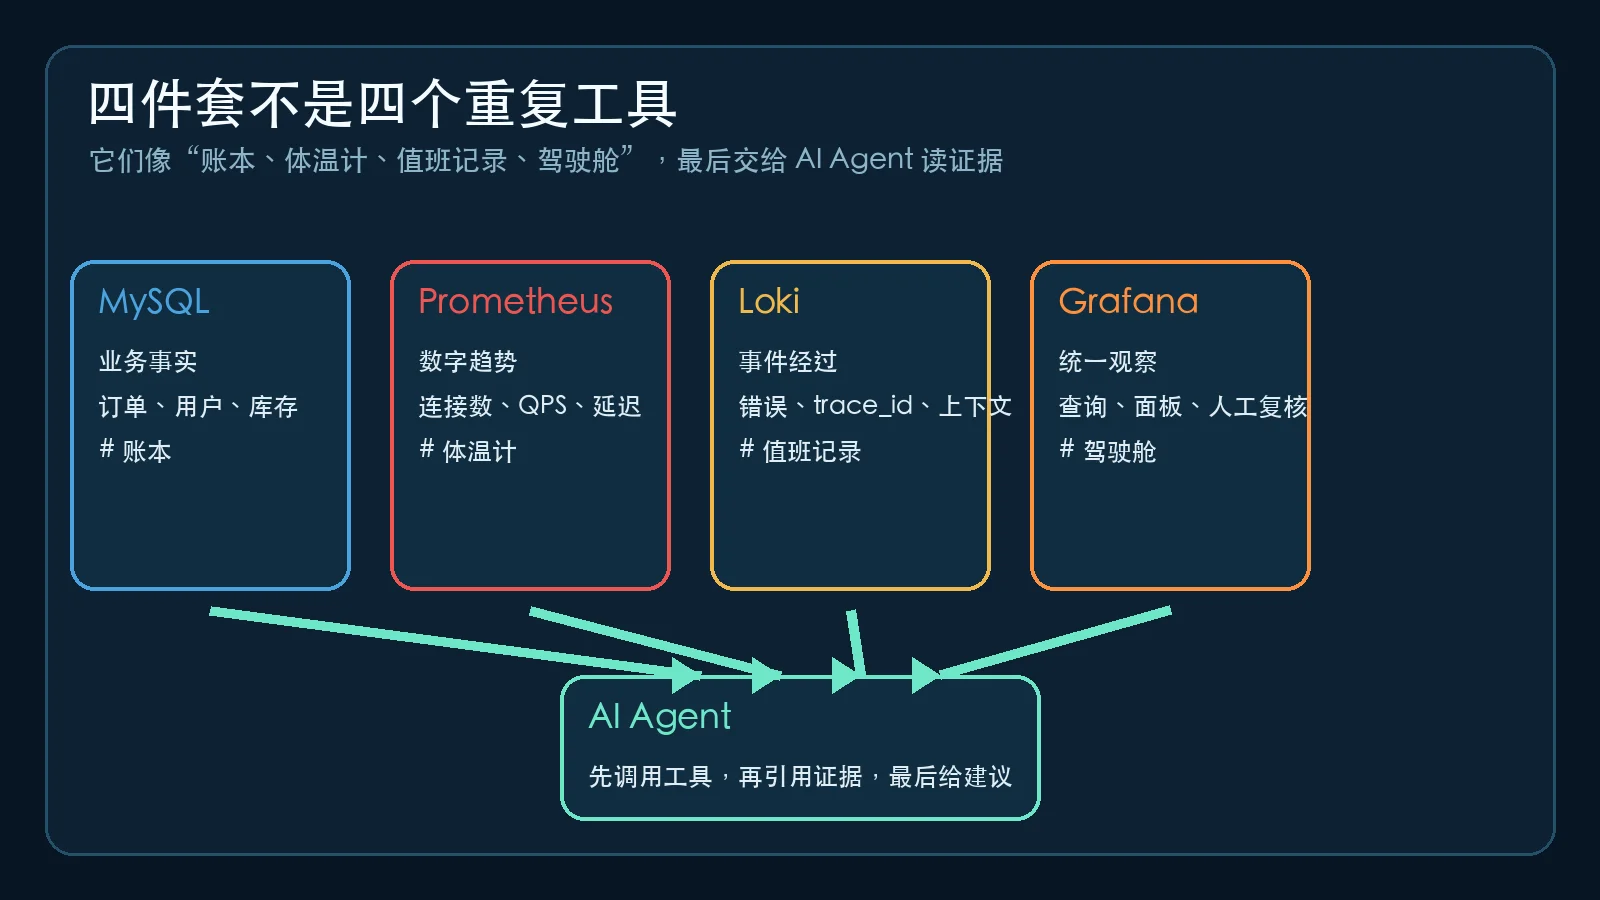
What each component does, explained with everyday objects
MySQL is the official ledger
MySQL stores orders, users, inventory and payment state. If the question is “Was this order actually paid?”, the database record is the authoritative fact.
Think of it as a school grade book. It is excellent at telling you who took a test and what score they received. It is not designed to redraw a graph of the entire school’s average every five seconds.
Prometheus is an automatic thermometer
Prometheus periodically scrapes metrics and stores time series. mysqld_exporter translates MySQL server status into metrics that Prometheus understands, such as connections, queries and thread activity.
A single thermometer reading tells you the temperature now. A sequence tells you whether it rose suddenly, remained high or returned to normal. That time dimension is why Prometheus is much more useful than a single status command during an incident.
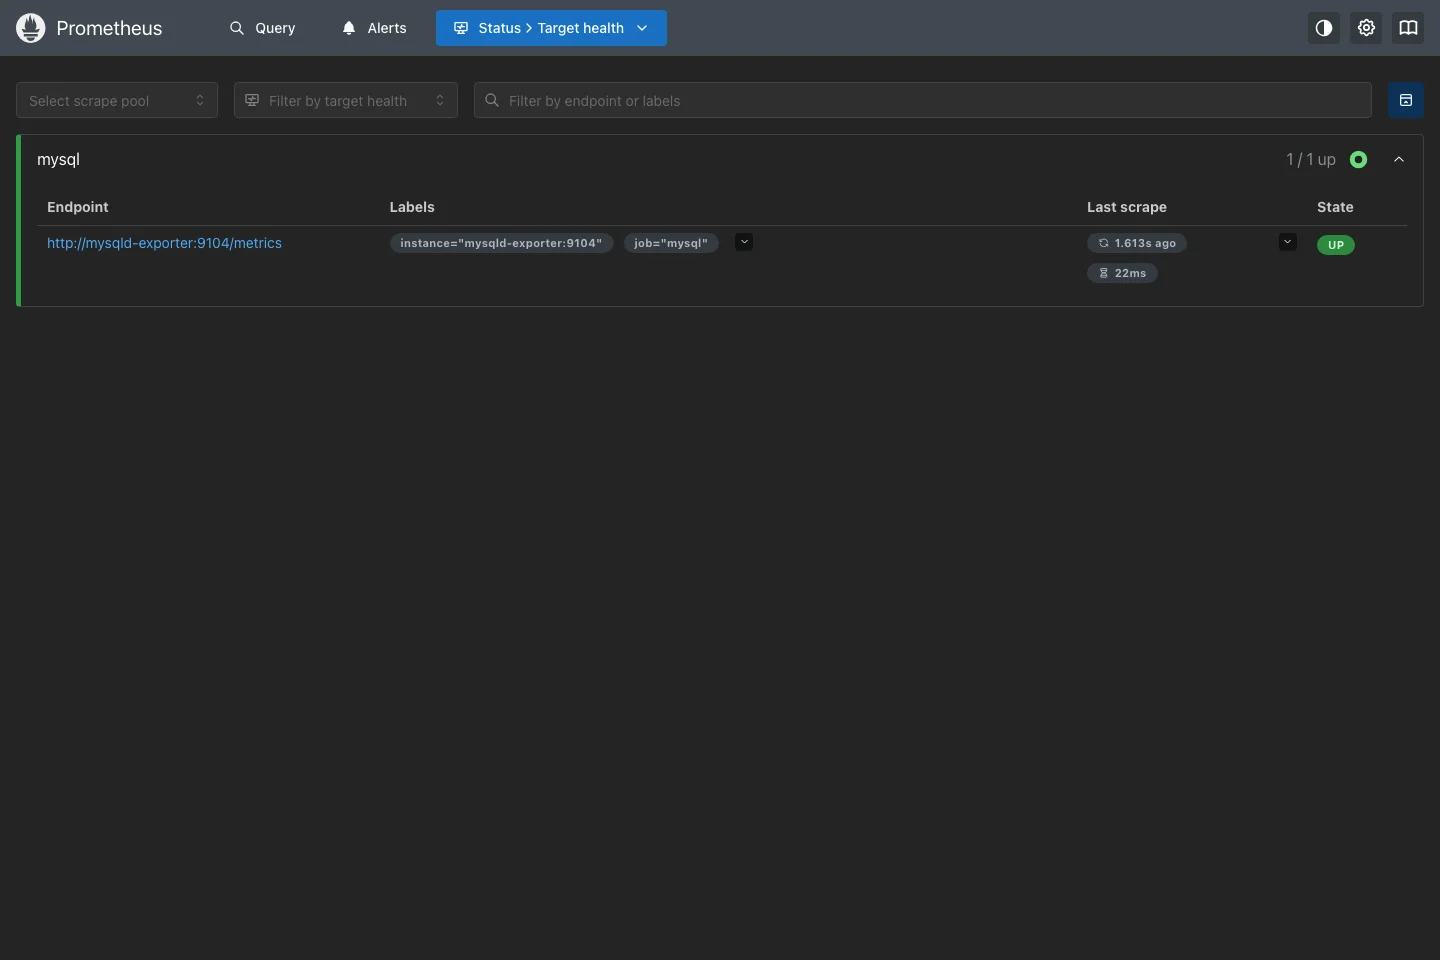
The screenshot below comes from the real lab. The mysql scrape target is UP, proving that Prometheus can reach the exporter and collect MySQL metrics.
Loki is the on-call event notebook
Loki stores logs and queries them with LogQL. A log can tell you what happened, at what time, in which service and under which trace ID.
The thermometer may show a fever. The event notebook may say that an allergic reaction started ten minutes after a medicine was given. Neither source is enough by itself, but together they provide a much stronger explanation.
Loki is not simply “a cheaper Elasticsearch.” Its indexing model encourages low-cardinality labels and filters log streams after label selection. User IDs and order IDs usually should not become labels because their cardinality grows without a practical bound. Keep them in the log body or structured metadata instead.
Grafana is the cockpit
Grafana can connect to Prometheus, Loki and MySQL. Humans can inspect graphs, logs, tables and alerts in one interface and verify whether the Agent’s conclusion is actually supported by data.
A car dashboard does not replace the engine, fuel tank or tires. It makes their most important state visible in one place. Grafana plays the same role for observability data.
Why an MCP bridge is necessary
A language model cannot reliably see your current database or monitoring state by itself. Knowing PromQL syntax does not tell it whether your present mysql_up value is 1 or 0.
MCP can be compared to a hotel front desk. A guest cannot walk into every storage room, but can make a standardized request such as “show me error logs from the last 30 minutes.” The front desk checks permissions, time limits and parameters, then returns the allowed result.
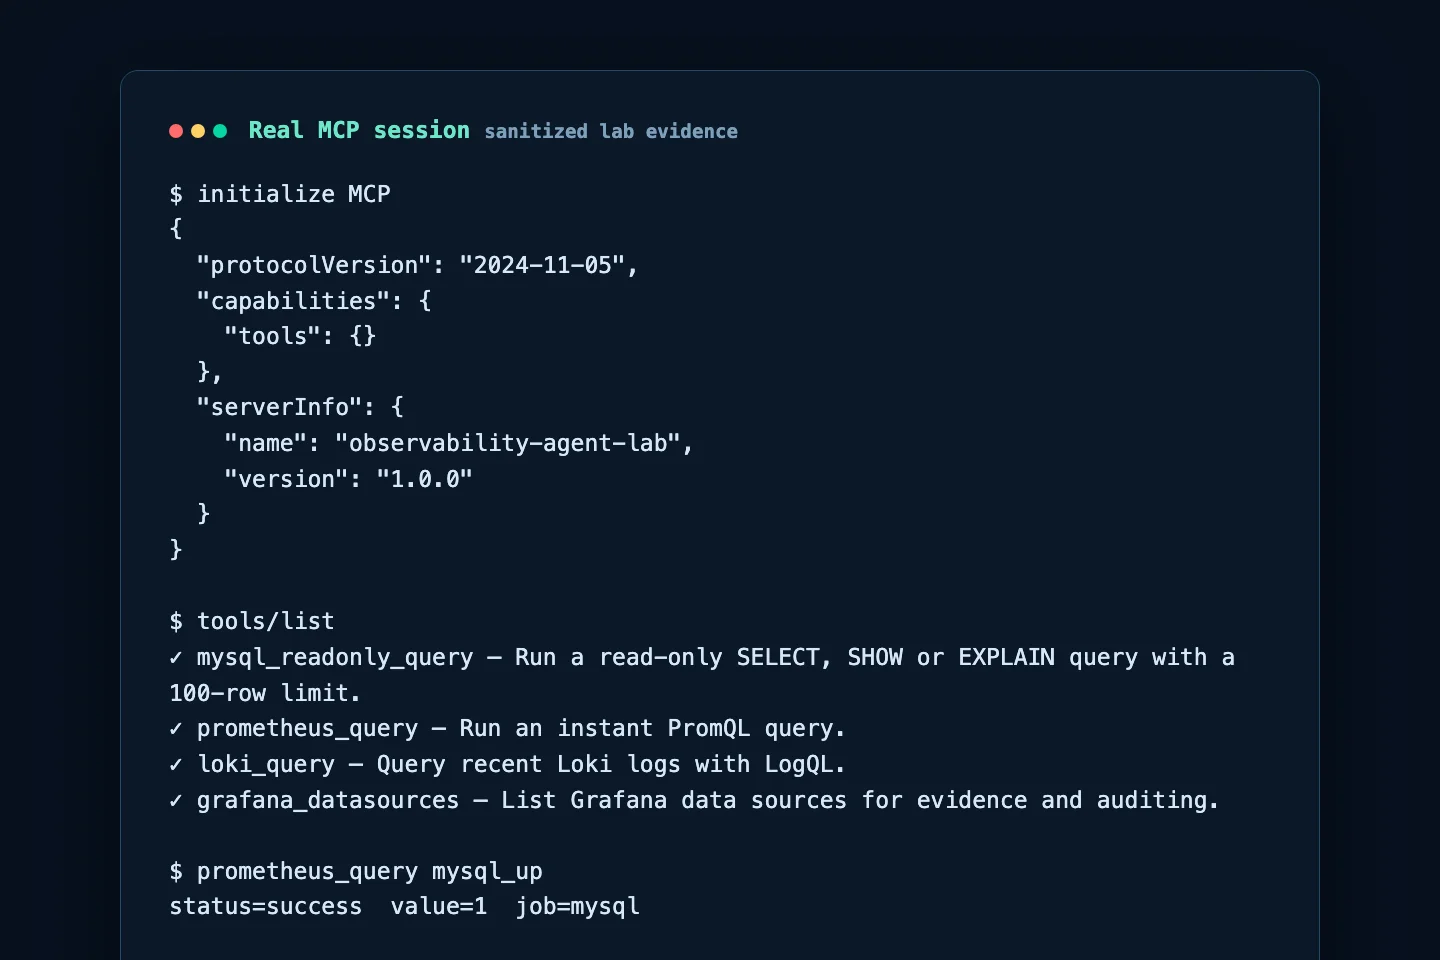
The lab bridge exposes four tools:
mysql_readonly_queryaccepts onlySELECT,SHOWandEXPLAIN, with a 100-row result limit.prometheus_queryexecutes an instant PromQL query.loki_queryruns LogQL within a bounded recent time window.grafana_datasourceslists configured Grafana data sources so the connection target can be audited.
The next image is a real MCP session. The client initializes the server, discovers all four tools, reads mysql_up=1, and obtains a read-only incident record from MySQL.
The incident: why did checkout become slow?
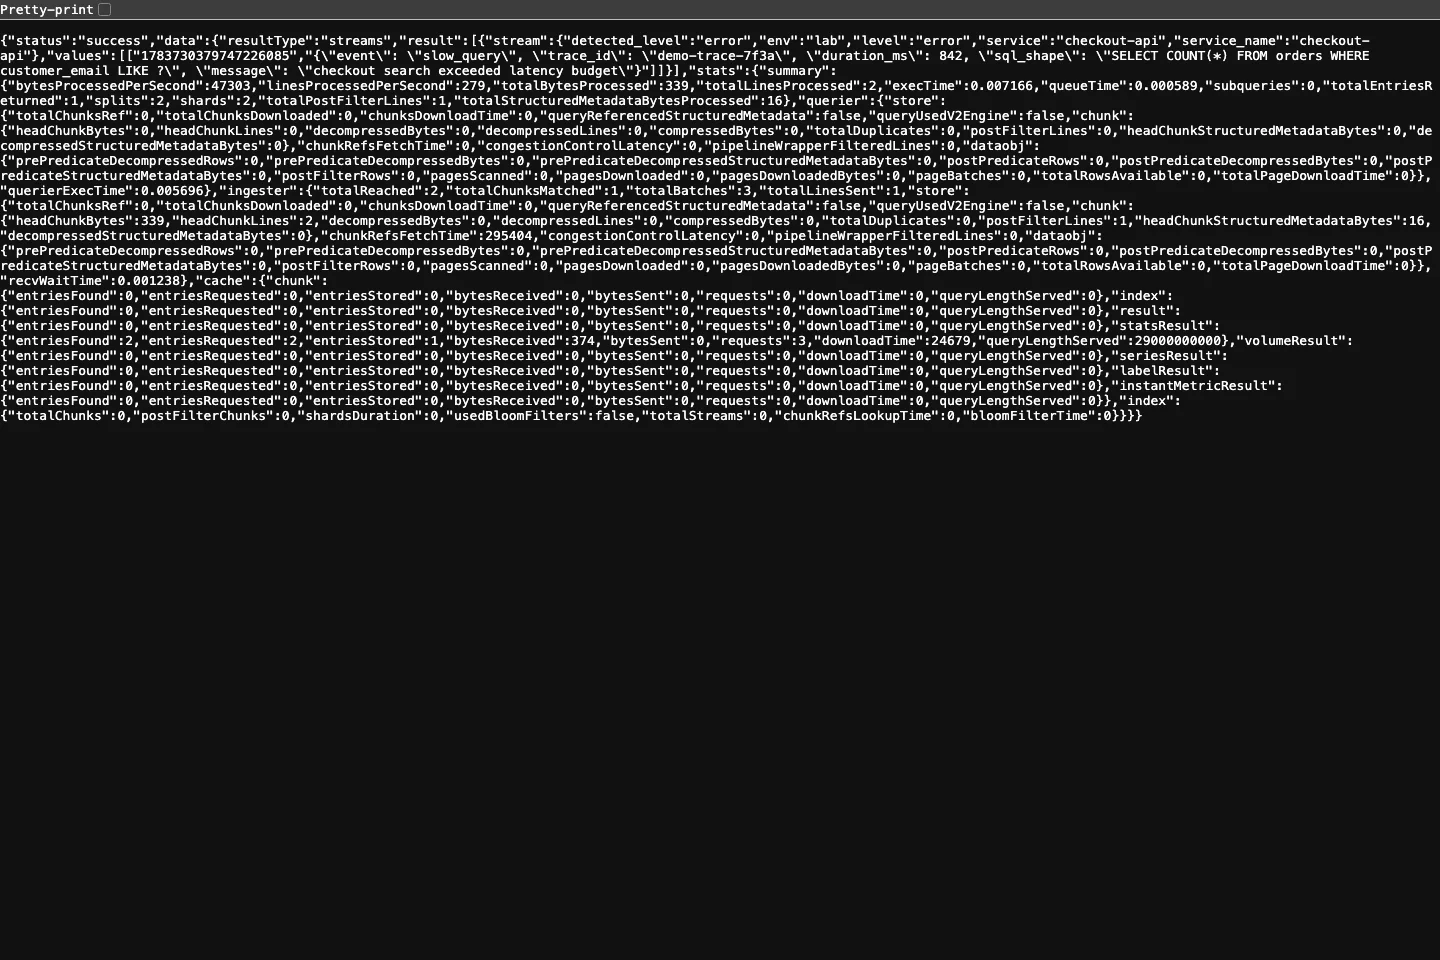
The lab pushes two structured events into Loki. One records a slow query and the other records an upstream timeout. Both use the same sanitized demonstration trace ID.
{
  "event": "slow_query",
  "trace_id": "demo-trace-7f3a",
  "duration_ms": 842,
  "sql_shape": "SELECT COUNT(*) FROM orders WHERE customer_email LIKE ?"
}
Only the SQL shape is logged. The real parameter, email address and complete statement are intentionally excluded. This is an important production habit: remove sensitive values before logs leave the application, not after they reach a dashboard.
The screenshot below is the real Loki query response. It contains the checkout-api slow-query event and the shared trace ID.
A responsible Agent does not begin by writing a polished answer. It investigates in a controlled order:
- Query Prometheus to confirm that MySQL and the exporter are alive.
- Query Loki for the error time, query shape and trace ID.
- Use the read-only MySQL tool to inspect the incident record or relevant business state.
- Audit Grafana data sources to ensure the tools are not connected to the wrong environment.
- Only then produce a conclusion that separates confirmed facts from remaining hypotheses.
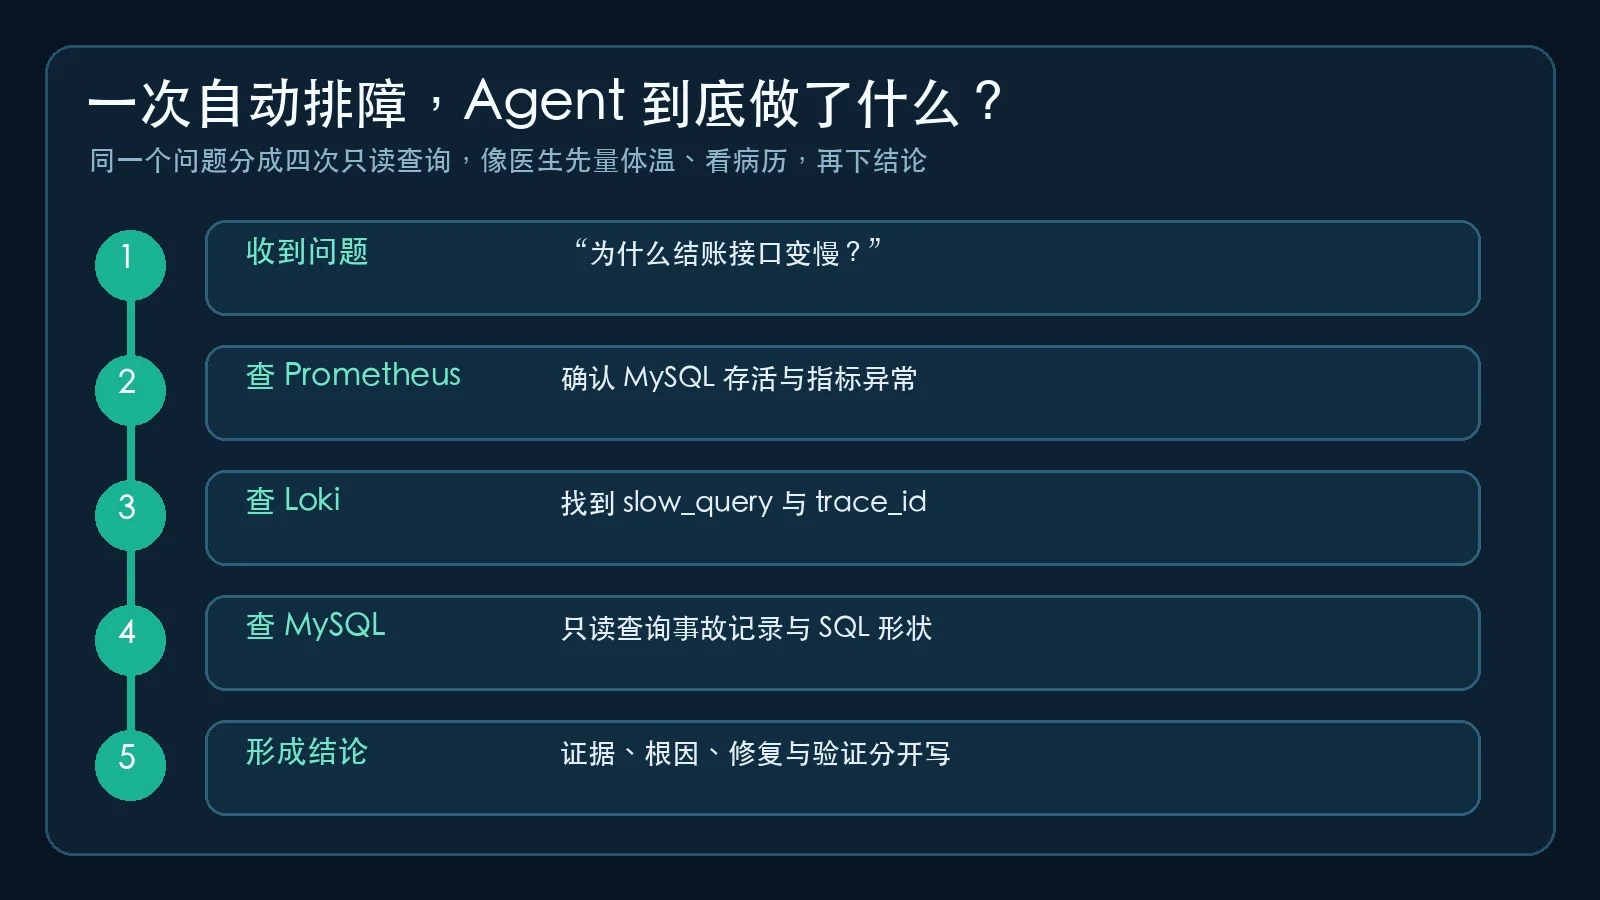
The lab conclusion was straightforward. MySQL was alive and metric collection was healthy. The application log showed an 842-millisecond order search followed by a timeout. The database incident record identified a leading-wildcard filter that ordinary indexing could not use efficiently. The sensible next step is to change the search pattern, add an index aligned with the real predicate, or use a dedicated search mechanism. Restarting MySQL would hide the symptom temporarily without addressing the cause.
One-click installers for Windows 11, Ubuntu 26.04 and macOS 26
The complete self-hosted lab is available with this article:
- Complete lab ZIP archive
- Windows 11 PowerShell installer
- Ubuntu 26.04 Bash installer
- macOS 26 Bash installer
Each installer generates random local passwords, starts MySQL, the exporter, Prometheus, Loki, Grafana and the Agent bridge, pushes the synthetic incident, and writes an agent-mcp.json file.
Windows 11
Open PowerShell in the extracted directory:
Set-ExecutionPolicy -Scope Process Bypass
.\install-windows-11.ps1
If Docker Desktop is missing, the script installs it with winget, starts it and waits until the engine becomes ready.
Ubuntu 26.04
chmod +x install-ubuntu-26.04.sh
./install-ubuntu-26.04.sh
If Docker is missing, the script installs docker.io and the Compose plugin from the operating system repository. If the current user cannot access the Docker socket, it uses sudo docker for the lab startup.
macOS 26
chmod +x install-macos-26.sh
./install-macos-26.sh
The script uses an existing Docker engine. If Docker is absent but Homebrew is available, it installs Docker Desktop and waits for the engine.
After startup, the local interfaces are:
Grafana:    http://localhost:13000
Prometheus: http://localhost:19090
Ports bind only to the loopback interface, so the lab is not exposed to the local network by default. Stop it with docker compose down, or remove all demonstration volumes with docker compose down -v.
Manual Agent configuration
The installer generates a configuration similar to this:
{
  "mcpServers": {
    "observability-lab": {
      "command": "docker",
      "args": [
        "compose", "-f", "/your/lab/docker-compose.yml",
        "run", "--rm", "-T", "agent-bridge"
      ]
    }
  }
}
Merge the observability-lab entry into the MCP configuration used by your Agent client, then restart the client. Configuration locations differ, so do not overwrite the entire file blindly.
Begin with a low-risk validation prompt:
List the tools exposed by observability-lab.
Call prometheus_query for mysql_up.
Call loki_query for checkout-api slow_query events from the last 30 minutes.
Do not write data or modify any configuration.
Agent-assisted automatic configuration
If your Agent can edit local files, give it an explicit, bounded instruction:
Read agent-mcp.json from the current directory and merge observability-lab
into your existing MCP server configuration without deleting other servers.
Create a timestamped backup before editing, re-read the result, and show the diff.
Then run only tools/list and a mysql_up query for validation.
Do not perform SQL writes, shell modifications, or container deletion.
The important part is not that the Agent edits a file. The important part is that the allowed file, backup rule, verification action and prohibited behavior are all explicit.
Two real problems found during the lab
Three containers failed with Permission denied although every file existed
The first archive copied from macOS to Linux changed configuration files to owner-only permissions. MySQL, Prometheus and Loki run as non-root users inside their containers, so all three were unable to read the mounted files.
The root cause was the shared file boundary, not three unrelated image failures. Correct permissions fixed the problem:
find . -type d -exec chmod 755 {} +
find . -type f -exec chmod 644 {} +
chmod 755 init.sh install-*.sh
Grafana tried to parse ._dashboards.yml
The next failure was more subtle. The macOS archive contained AppleDouble ._* metadata files. Grafana treated ._dashboards.yml as a provisioning file and stopped because the binary metadata contained invalid YAML control characters.
The dashboard JSON was not the cause. The cross-platform packaging metadata was. A temporary cleanup is:
find . -name '._*' -delete
A proper archive process should disable AppleDouble data or use a packaging method that does not carry those files. When several services fail at the same time, inspect shared boundaries such as permissions, mounts, networking and environment propagation before reinstalling each component independently.
Security boundaries required in production
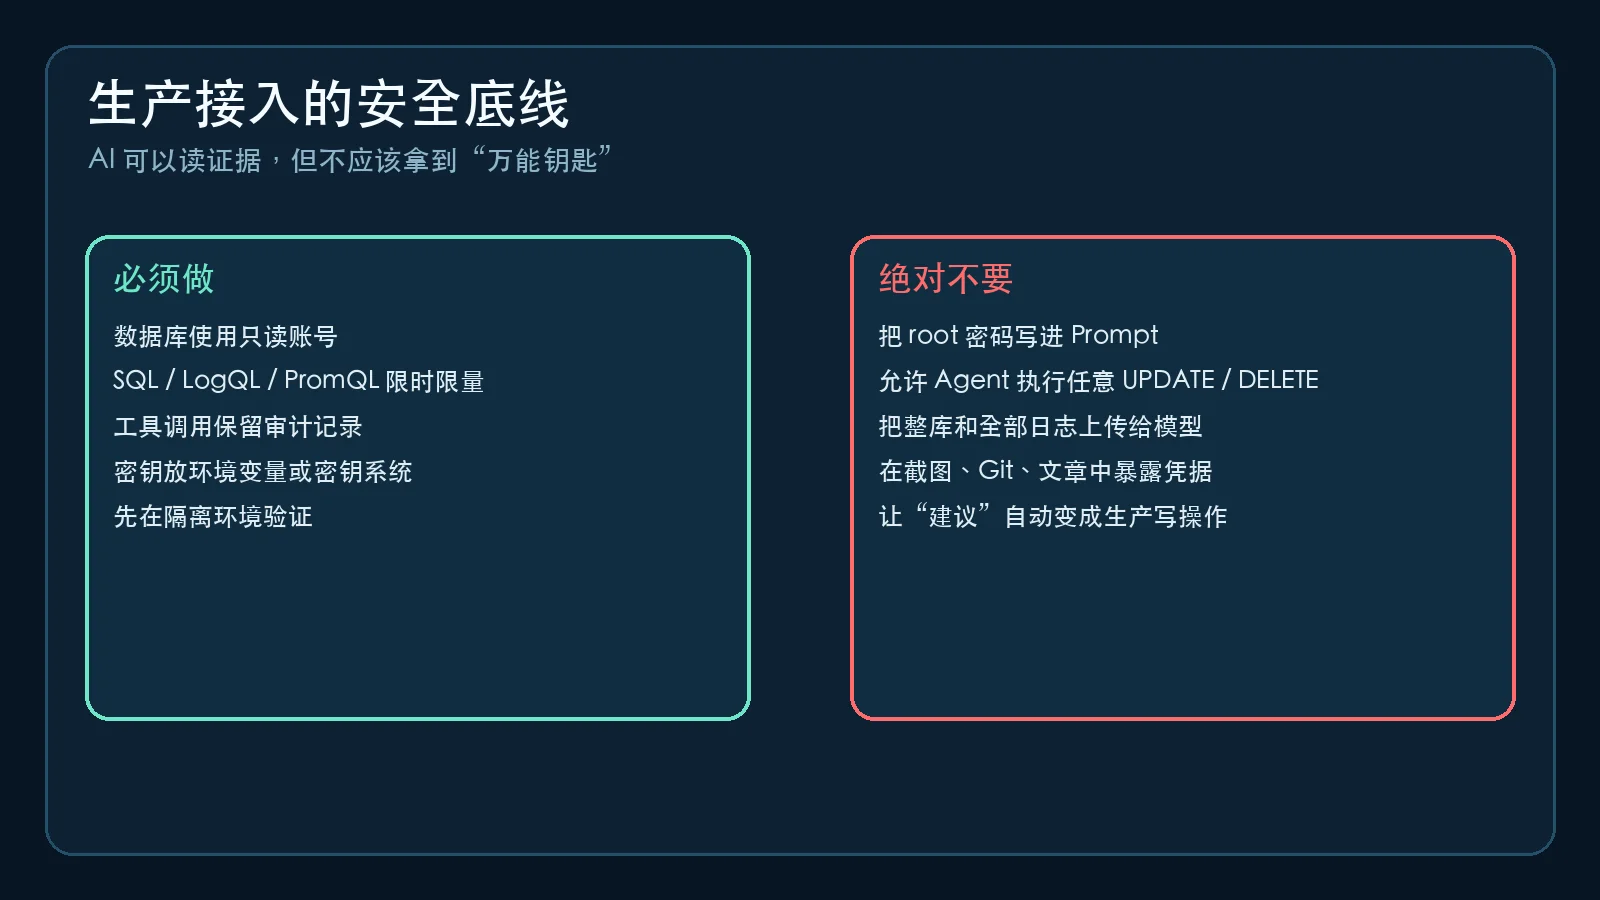
A working lab is not a production design. Production should add at least these controls:
- Create a separate MySQL read-only user limited to approved schemas and views.
- Never grant root, DDL, DML or unrestricted stored-procedure execution to the Agent.
- Parse and restrict SQL type, row count, timeout and concurrency.
- Limit PromQL and LogQL time ranges, result counts and maximum processed data.
- Redact sensitive fields before ingestion.
- Audit every tool call with identity, parameter summary, time, result size and error state.
- Keep recommendations separate from changes; require human approval for production writes.
- Give Grafana tokens the smallest possible role and rotate them.
- Do not upload complete databases, unrestricted logs or credentials to an uncontrolled external model service.
Q&A
Why not let the Agent read the Grafana web page directly?
Web pages are designed for people. Their DOM changes, screenshots omit exact values, and browser automation is brittle. Stable APIs or MCP tools are better for machine queries, while Grafana remains valuable for human verification.
Can the Agent repair the incident automatically?
Technically yes, but that should not be the first milestone. Start with read-only evidence collection, recommendations and a verification checklist. Introduce a small number of low-risk, approval-gated remediation tools only after auditing, rollback and permission controls are mature.
How are MySQL, Prometheus and Loki correlated?
The common links are time, service, environment and trace ID. Metrics show when behavior changed, logs show which request failed, and MySQL confirms the business fact. Avoid turning order IDs or user IDs into Prometheus or Loki labels because they create uncontrolled cardinality.
Is the custom bridge mandatory?
No. Grafana provides an official MCP server that may fit your production requirements. The custom bridge exists to keep SQL, PromQL, LogQL and Grafana auditing in one small, inspectable, self-hosted teaching example.
Does the lab depend on an external SaaS platform?
No. The data remains inside the local Docker network and local volumes. Internet access is needed to download images and packages, but runtime queries and MCP calls do not depend on a hosted observability service.
Final takeaway
MySQL, Prometheus, Loki and Grafana are not four competing products. MySQL stores business facts, Prometheus stores numeric trends, Loki stores event context and Grafana provides a unified human view. An AI Agent is an assistant that knows how to use those sources.
The decisive factor is not model intelligence. It is whether tools are read-only, data can be correlated, queries are bounded, conclusions cite evidence, and changes require approval.
An Agent with only a chat box can guess. An Agent with carefully designed observability tools can become a reliable on-call assistant.
Official references
- Prometheus HTTP API: https://prometheus.io/docs/prometheus/latest/querying/api/
- Prometheus mysqld_exporter: https://github.com/prometheus/mysqld_exporter
- Loki HTTP API: https://grafana.com/docs/loki/latest/reference/loki-http-api/
- Grafana provisioning: https://grafana.com/docs/grafana/latest/administration/provisioning/
- Grafana MCP Server: https://github.com/grafana/mcp-grafana
- MySQL documentation: https://dev.mysql.com/doc/