Your Clock Is 700 ms Wrong: What NTP Really Does Behind the Scenes
The short answer
NTP is not “ask a server for the time and overwrite the clock.” It is a measurement and control loop. A client records when a packet leaves and returns; the server records when it arrives and leaves. Four timestamps estimate offset and round-trip delay. Multiple sources are then sanity-checked, filtered, clustered, and combined before the operating system slews or steps the clock.
1. Why clock problems hide in plain sight
A browser can work while logs disagree, certificates appear too early, Kerberos rejects a login, or a database event seems to happen before its cause. Think of a classroom where every child wears a watch. The teacher has the reference watch, but a message takes time to walk down the corridor. NTP repeatedly measures both the watches and the corridor. It trusts low-delay, stable measurements rather than a single loud answer.
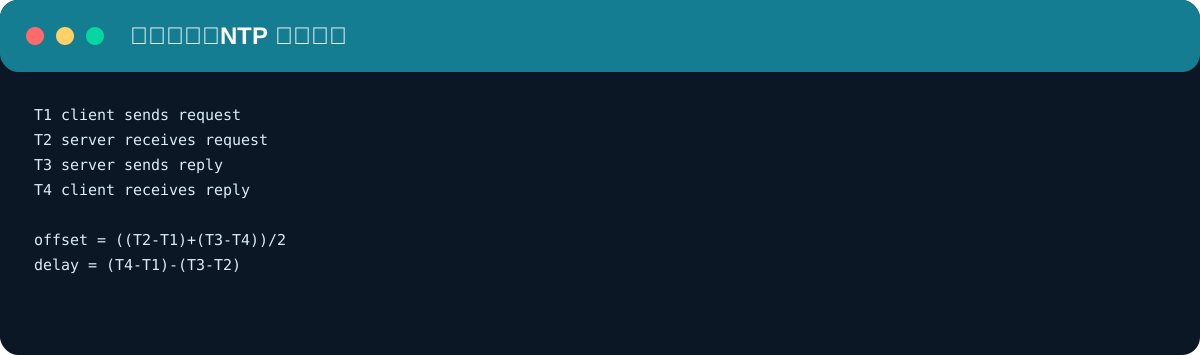
Figure 1: Original diagram. NTP’s core is four times, not one time.
2. One exchange and its 48-byte packet
NTP normally uses UDP port 123. The client sends a request. The server fills receive and transmit timestamps and replies. T1 is client transmit, T2 server receive, T3 server transmit, and T4 client receive.
offset θ = ((T2 - T1) + (T3 - T4)) / 2
delay  δ = (T4 - T1) - (T3 - T2)
Offset says which watch is fast. Delay says how long the message took round trip. NTP timestamps use a 1900 epoch with 32-bit seconds and 32-bit fraction; Unix conversion subtracts the epoch gap. Real error also comes from NIC queues, scheduling, VM pauses, and server load.
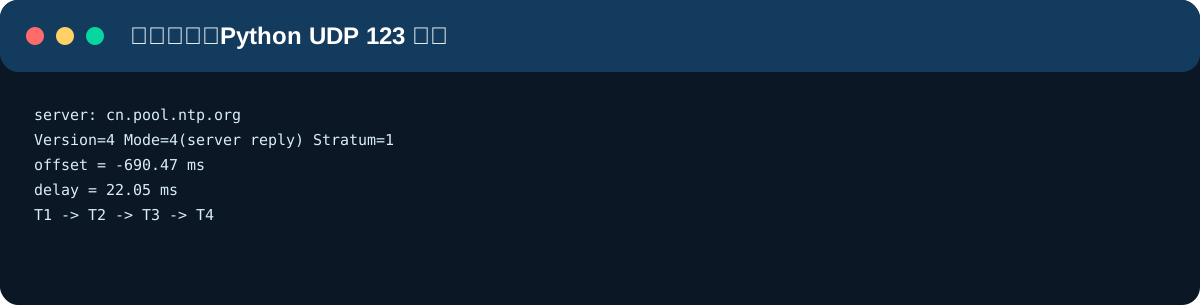
Figure 2: Real probe output. A tiny Python client exposes stratum, offset and delay.
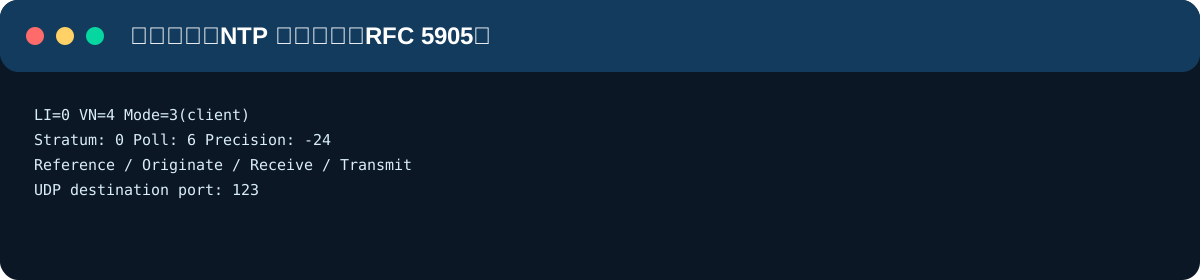
Figure 3: Real field summary. Wireshark can filter NTP traffic with ntp.
3. Stratum is a distance, not a score
Stratum 0 usually means a reference clock such as GPS or an atomic clock. A directly attached server is Stratum 1; downstream servers are 2, 3, and so on. Stratum 16 means unsynchronized. A Stratum 2 source with low delay and stable jitter may be better for you than a distant Stratum 1.
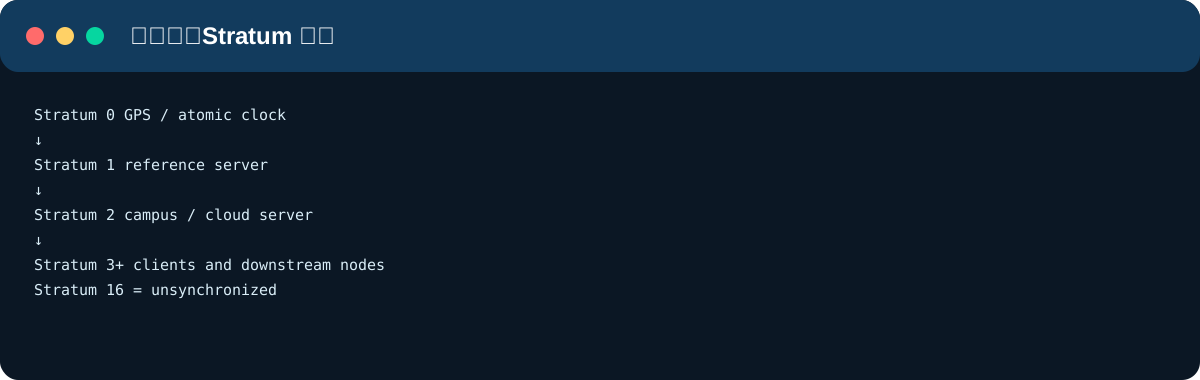
Figure 4: Stratum is the number of hand-offs from the reference clock.
With several sources, NTP performs sanity checks and uses an intersection algorithm derived from Marzullo’s algorithm to reject falsetickers. It then clusters and combines the survivors. This is closer to measuring a blackboard with several rulers and discarding outliers than to a simple majority vote.
4. Clock filtering and the control loop
Networks jitter. One sample can hit a retransmission or a busy queue. NTP keeps recent samples, commonly eight, and weighs delay, offset, dispersion, and jitter. It does not blindly trust the newest sample.
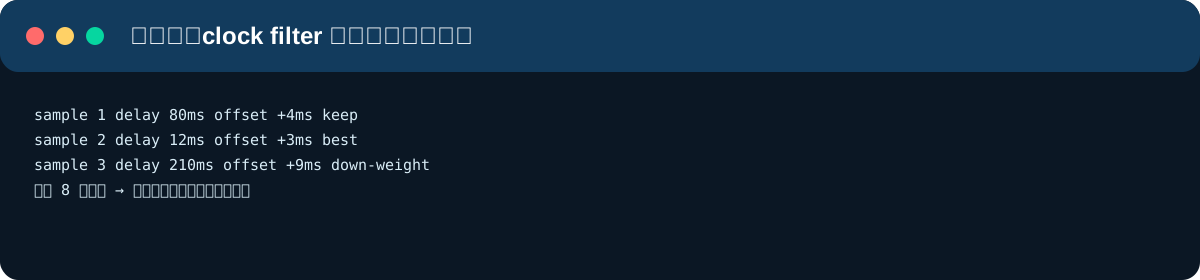
Figure 5: Recent samples are ranked by quality.
Small corrections are normally slewed: the clock frequency is adjusted so time remains continuous. Larger corrections may be stepped, changing wall-clock time immediately. Traditional ntpd deployments often use a step threshold around 128 ms and a panic threshold around 1000 seconds, but chrony, systemd-timesyncd, and Windows Time Service have different defaults. Always check the local implementation.
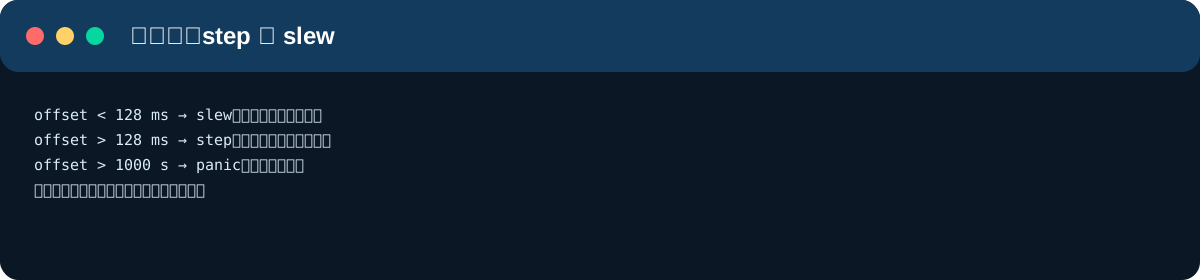
Figure 6: The key production question is whether applications can observe a backwards jump.
5. Real Windows 11 evidence
On a Windows 11 workstation, w32tm /query /status reported Leap indicator: 3 (unsynchronized), Stratum: 0, and Source: Local CMOS Clock. A w32tm /stripchart test measured roughly -672 ms and then timed out. A running service is not proof of a selected source. Check source, stratum, last successful sync, configuration, and event logs.
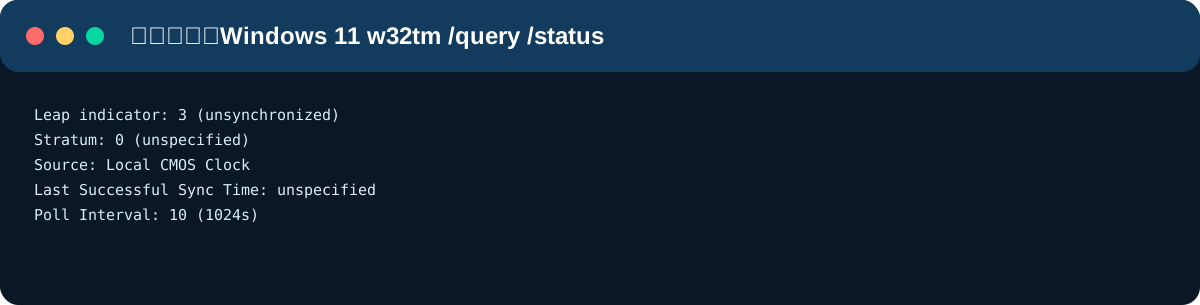
Figure 7: Real Windows status output.
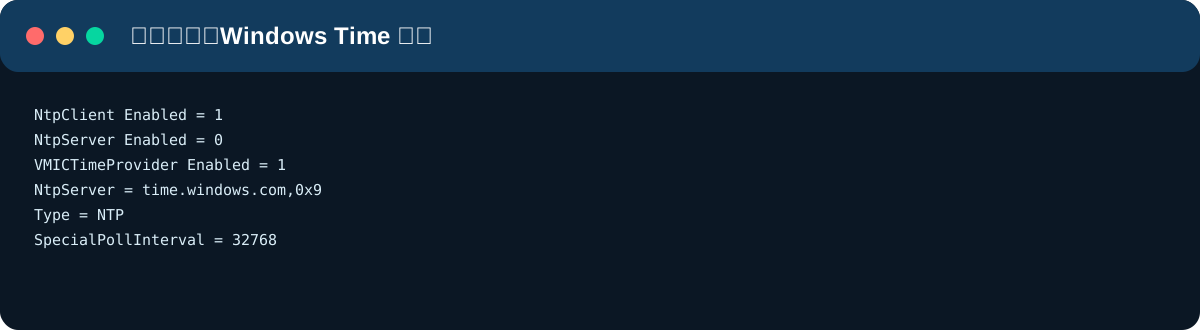
Figure 8: Real Windows Time configuration output.
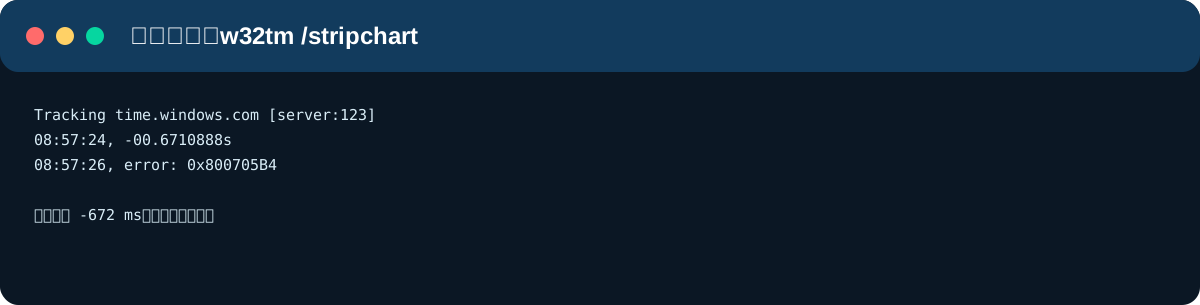
Figure 9: Real stripchart output: a measurement and a later timeout.
6. Linux, macOS, and a safe diagnostic workflow
Ubuntu commonly uses systemd-timesyncd or chrony. Use timedatectl status, chronyc tracking, chronyc sources -v, service status, and UDP socket inspection. macOS exposes network time through systemsetup; sntp -sS is useful for a controlled test. The workflow is identical: service → source → UDP 123 → offset/delay → stability.
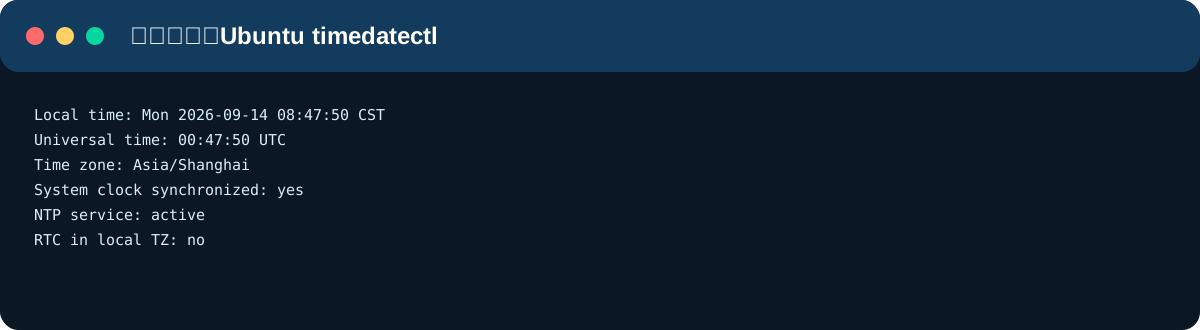
Figure 10: Real Ubuntu output. “Synchronized: yes” is useful, but not the whole investigation.
7. Leap seconds and surprising outages
UTC occasionally inserts a leap second: 23:59:59 → 23:59:60 → 00:00:00. Software that assumes timestamps always increase can calculate a negative duration. The 2012 leap-second incident exposed Linux-related problems; Cloudflare’s 2017 postmortem describes Go code panicking after a negative duration. Leap smear spreads the extra second over a longer interval. It is smoother for applications, but it is a policy choice, not a more “true” UTC.
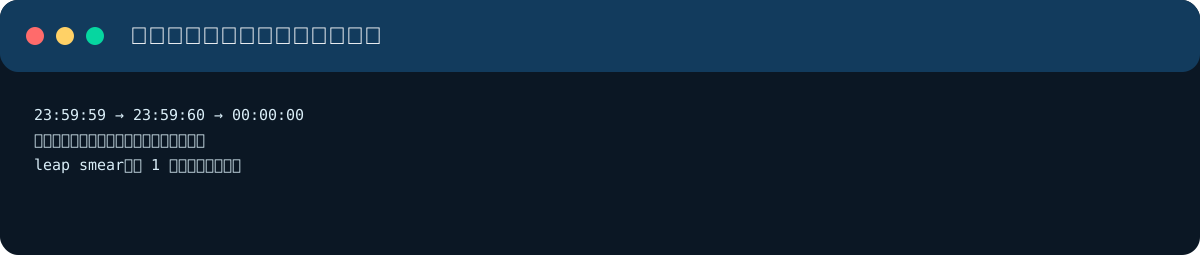
Figure 11: Leap second and leap smear.
8. One-click diagnostic scripts
The scripts below are intentionally dry-run reports. They do not install packages, change servers, delete configuration, or reboot.
Windows 11
$ErrorActionPreference='Continue'
Get-Service W32Time
w32tm /query /status
w32tm /query /configuration
w32tm /stripchart /computer:time.windows.com /samples:5 /dataonly
Get-WinEvent -LogName 'Microsoft-Windows-Time-Service/Operational' -MaxEvents 20
Manual method: run as Administrator, inspect the report, then use w32tm /resync only after confirming the source. Agent method: ask the Agent to collect status, configuration, stripchart and Time-Service events; dry-run only, no registry edits or reboot, then resync only after explicit confirmation.
Ubuntu 26.04
#!/usr/bin/env bash
set -u
timedatectl status
systemctl is-active systemd-timesyncd chrony chronyd 2>/dev/null || true
chronyc tracking 2>/dev/null || true
chronyc sources -v 2>/dev/null || true
ss -lunp | grep ':123' || true
journalctl -u systemd-timesyncd -u chrony -u chronyd -n 30 --no-pager 2>/dev/null || true
Manual method: run the report first and choose one time daemon before restarting it. Agent method: identify the active daemon, collect evidence, dry-run first, then repair only after confirmation and recheck offset, stratum, and reachability.
macOS 26
#!/bin/zsh
set -u
systemsetup -getusingnetworktime 2>&1
systemsetup -getnetworktimeserver 2>&1
sntp -S time.apple.com 2>&1 | head -20
netstat -anv -p udp | grep '\\.123 ' || true
Manual method: inspect first, then use sudo systemsetup -setusingnetworktime on if appropriate. Agent method: collect network-time, server, sntp and UDP 123 evidence; dry-run only, and wait for confirmation before changing settings.
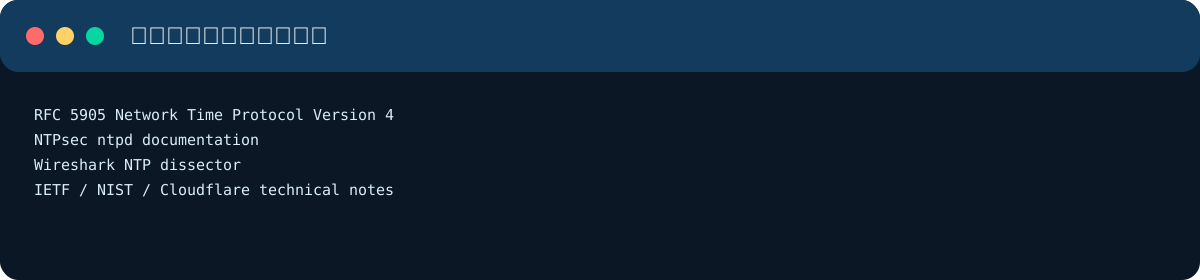
Figure 12: Reference material used for this article.
9. Root-cause checklist and Q&A
Usual causes are blocked UDP 123, bad DNS or distant sources, VM pauses, multiple time daemons competing, startup offsets beyond a daemon’s safe threshold, a single upstream, and inconsistent leap-second policy.
Can NTP reach atomic-clock accuracy? Ordinary Internet NTP cannot promise it; use hardware timestamping, PTP, GPS, or a dedicated link for higher precision. Why UDP? A lost measurement is cheap; TCP setup and retransmission would distort the delay model. Why use a monotonic clock? Wall clocks can step; elapsed-time measurement should use a monotonic source. Can I use one source? It works but is not fault tolerant; use multiple sources and monitor offset, jitter, and reachability.