Why Can a QR Code Still Scan After Losing a Corner? It Has Backups, Not Magic
The short answer
A QR code can sometimes survive a missing corner because the encoder stores more than the original message. It also adds redundant information that lets a decoder detect and repair a bounded amount of damage. If the missing part is mainly in the data area, the remaining modules and the error-correction codewords may be enough to reconstruct the payload.
But “one missing corner” is not a precise engineering measurement. A corner that contains ordinary data may be recoverable. A small cut through one of the three large finder patterns can be much worse: the scanner may fail to locate and orient the symbol before it even reaches the error-correction stage.

Figure 1: Original artwork made for this article. A QR code behaves less like a single copy of an answer and more like a dictation exercise with extra clues.
You have probably seen this in real life: a poster is torn, a shipping label is covered by tape, or someone puts a logo in the middle of a QR code, yet a phone still opens the destination. Where is the missing information coming from? How can the camera know what the covered black and white modules should have been?
This article starts with a reproducible local experiment and then explains the algorithm through a familiar analogy: a dictation sentence with a few missing characters. We will separate the QR layout, finder patterns, codewords, Reed–Solomon error correction, the meaning of L/M/Q/H, and the common mistake of treating “30% correction” as “30% of the picture can be painted over.”
Background: a QR code stores clues, not only the answer
The simplest mental model of a QR code is a sheet of black and white squares. A black module represents one value, a white module another, and the scanner converts those modules back into text, a URL, or another payload. If the symbol stored only one copy of those bits, a dirty fingerprint or a tear would permanently remove information.
The QR design therefore stores the payload together with additional information that can detect and repair errors. This is not a full second copy of the message. Instead, the encoder computes check symbols with a known mathematical relationship to the data. A decoder can use the relationship to identify inconsistent codewords and recover some missing or corrupted ones.
It is similar to showing the work in a school exercise. If the final number is smudged, a teacher can use the intermediate calculation to check what the answer must have been. The QR code’s “working” is its error-correction data.
DENSO WAVE describes QR error correction as Reed–Solomon coding and documents four selectable levels: L, M, Q, and H. The same explanation makes an important distinction: the correction figures are expressed in codewords, not as a simple percentage of the visible black-and-white area.
What does “damaged” actually mean?
There are several different failure modes, and they should not be treated as the same problem.
A missing block in the data area
This is the classic “the corner is gone but it still scans” case. The lower-right area usually does not contain one of the three large finder patterns. Once the scanner has located and oriented the symbol, it can attempt to reconstruct missing data and correction codewords.
A logo or sticker in the middle
Center obstruction is often less dangerous than an obstruction over a finder pattern. QR modules are not simply stored from left to right. Data is placed along a defined path and interleaved, so a continuous physical block does not map to one obvious consecutive piece of text.
Many scattered spots
Random dirt can be harder than a neat rectangular cut. The camera must decide whether each module is black or white while also dealing with blur, reflections, and uneven lighting. Errors are no longer confined to one predictable region.
A damaged finder pattern
The three large squares near the top-left, top-right, and bottom-left corners are finder patterns. They act like three landmarks on a map: they tell the scanner where the symbol is, how it is rotated, and how large its modules are.
Finder patterns are not ordinary payload. They help the scanner enter the decoding process. If a landmark disappears, a decoder may fail before Reed–Solomon correction has any opportunity to help.
A real local experiment
To avoid explaining the result from a drawing alone, I generated the samples locally with macOS Core Image and decoded them offline with the macOS Vision QR detector. No online scanning website was used. The payload was a public demonstration sentence and contains no address, hostname, credential, or private infrastructure detail.
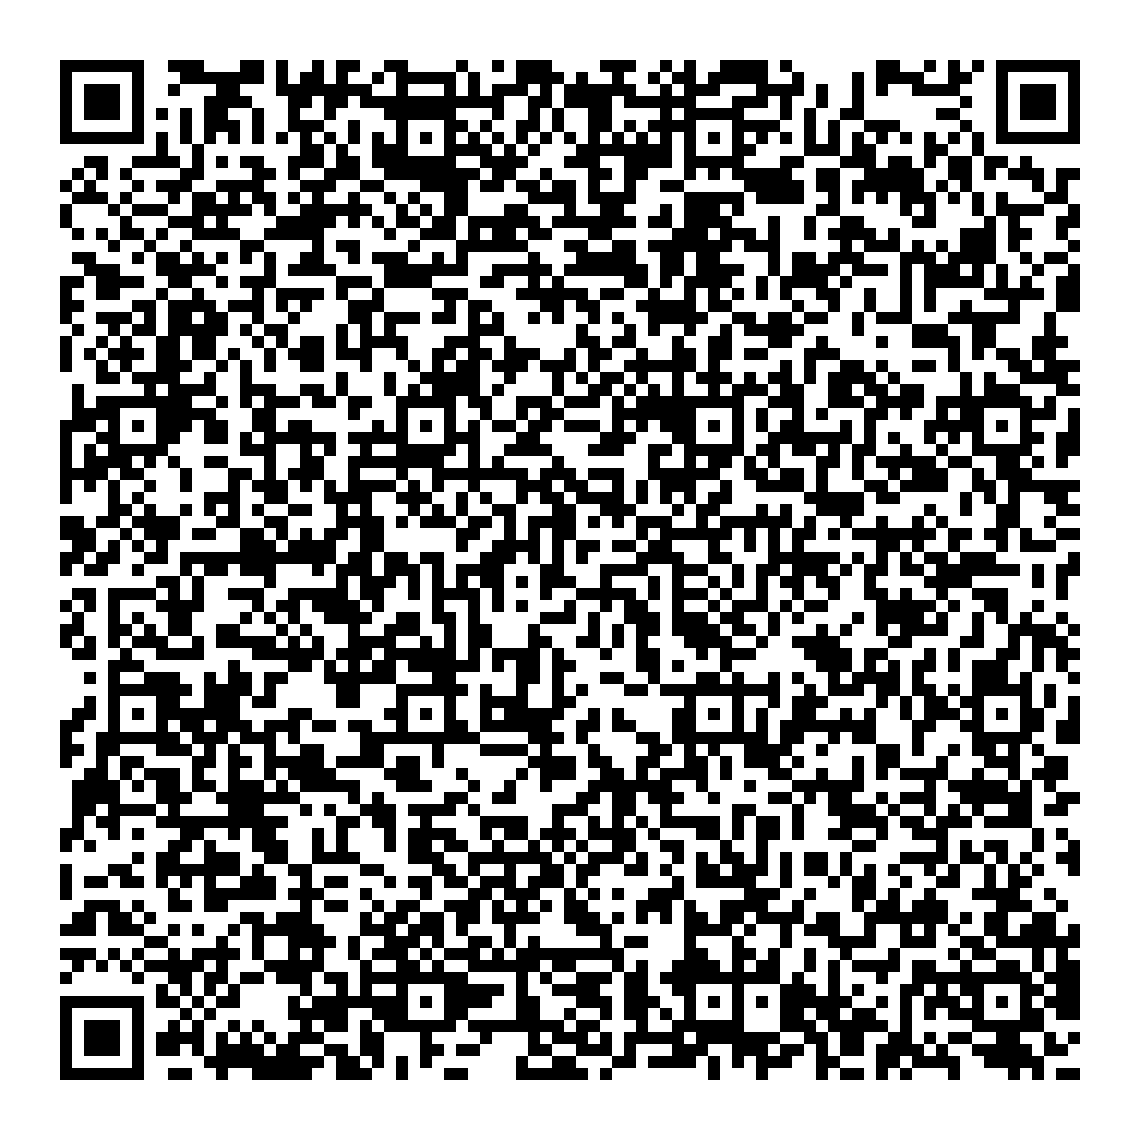
Figure 2: The intact QR sample used in the experiment. It carries a public demonstration payload and uses H-level correction.
The test covered all four correction levels and four damage patterns: an expanding lower-right corner cut, a center block, random white modules, and a removed top-left finder pattern. The percentages below describe the painted-over module area. They are not the correction percentages specified for QR codewords.

Figure 3: A small lower-right cut. The local Vision decoder still recovered the payload for this sample.

Figure 4: In this fixed sample, roughly 25.8% of the modules were removed in the corner area and the H-level symbol still decoded. This is an observation, not a universal guarantee.

Figure 5: When the cut reached roughly 35.6% of the module area, the sample failed. Error correction is not an unlimited eraser.
Reading the experiment
The results for this payload, this image size, and this decoder can be summarized as follows:
| Damage pattern | H-level result | What it shows |
|---|---|---|
| 10% of the side removed from the lower-right corner | Pass | About 1.1% of modules were painted over and the damage was mainly in the data region |
| 50% of the side removed | Pass | About 25.8% of module area was removed in this sample |
| 60% of the side removed | Fail | About 35.6% of module area exceeded the recoverable range for this sample |
| 20% side-length center block | Pass | A contiguous block and interleaved data can be more favorable than random noise |
| 10% random modules painted white | Fail | Scattered errors and sampling effects defeated this decoder |
| Top-left finder pattern removed | Fail | Only about 1.8% of module area was damaged, but the scanner lost its entrance landmark |
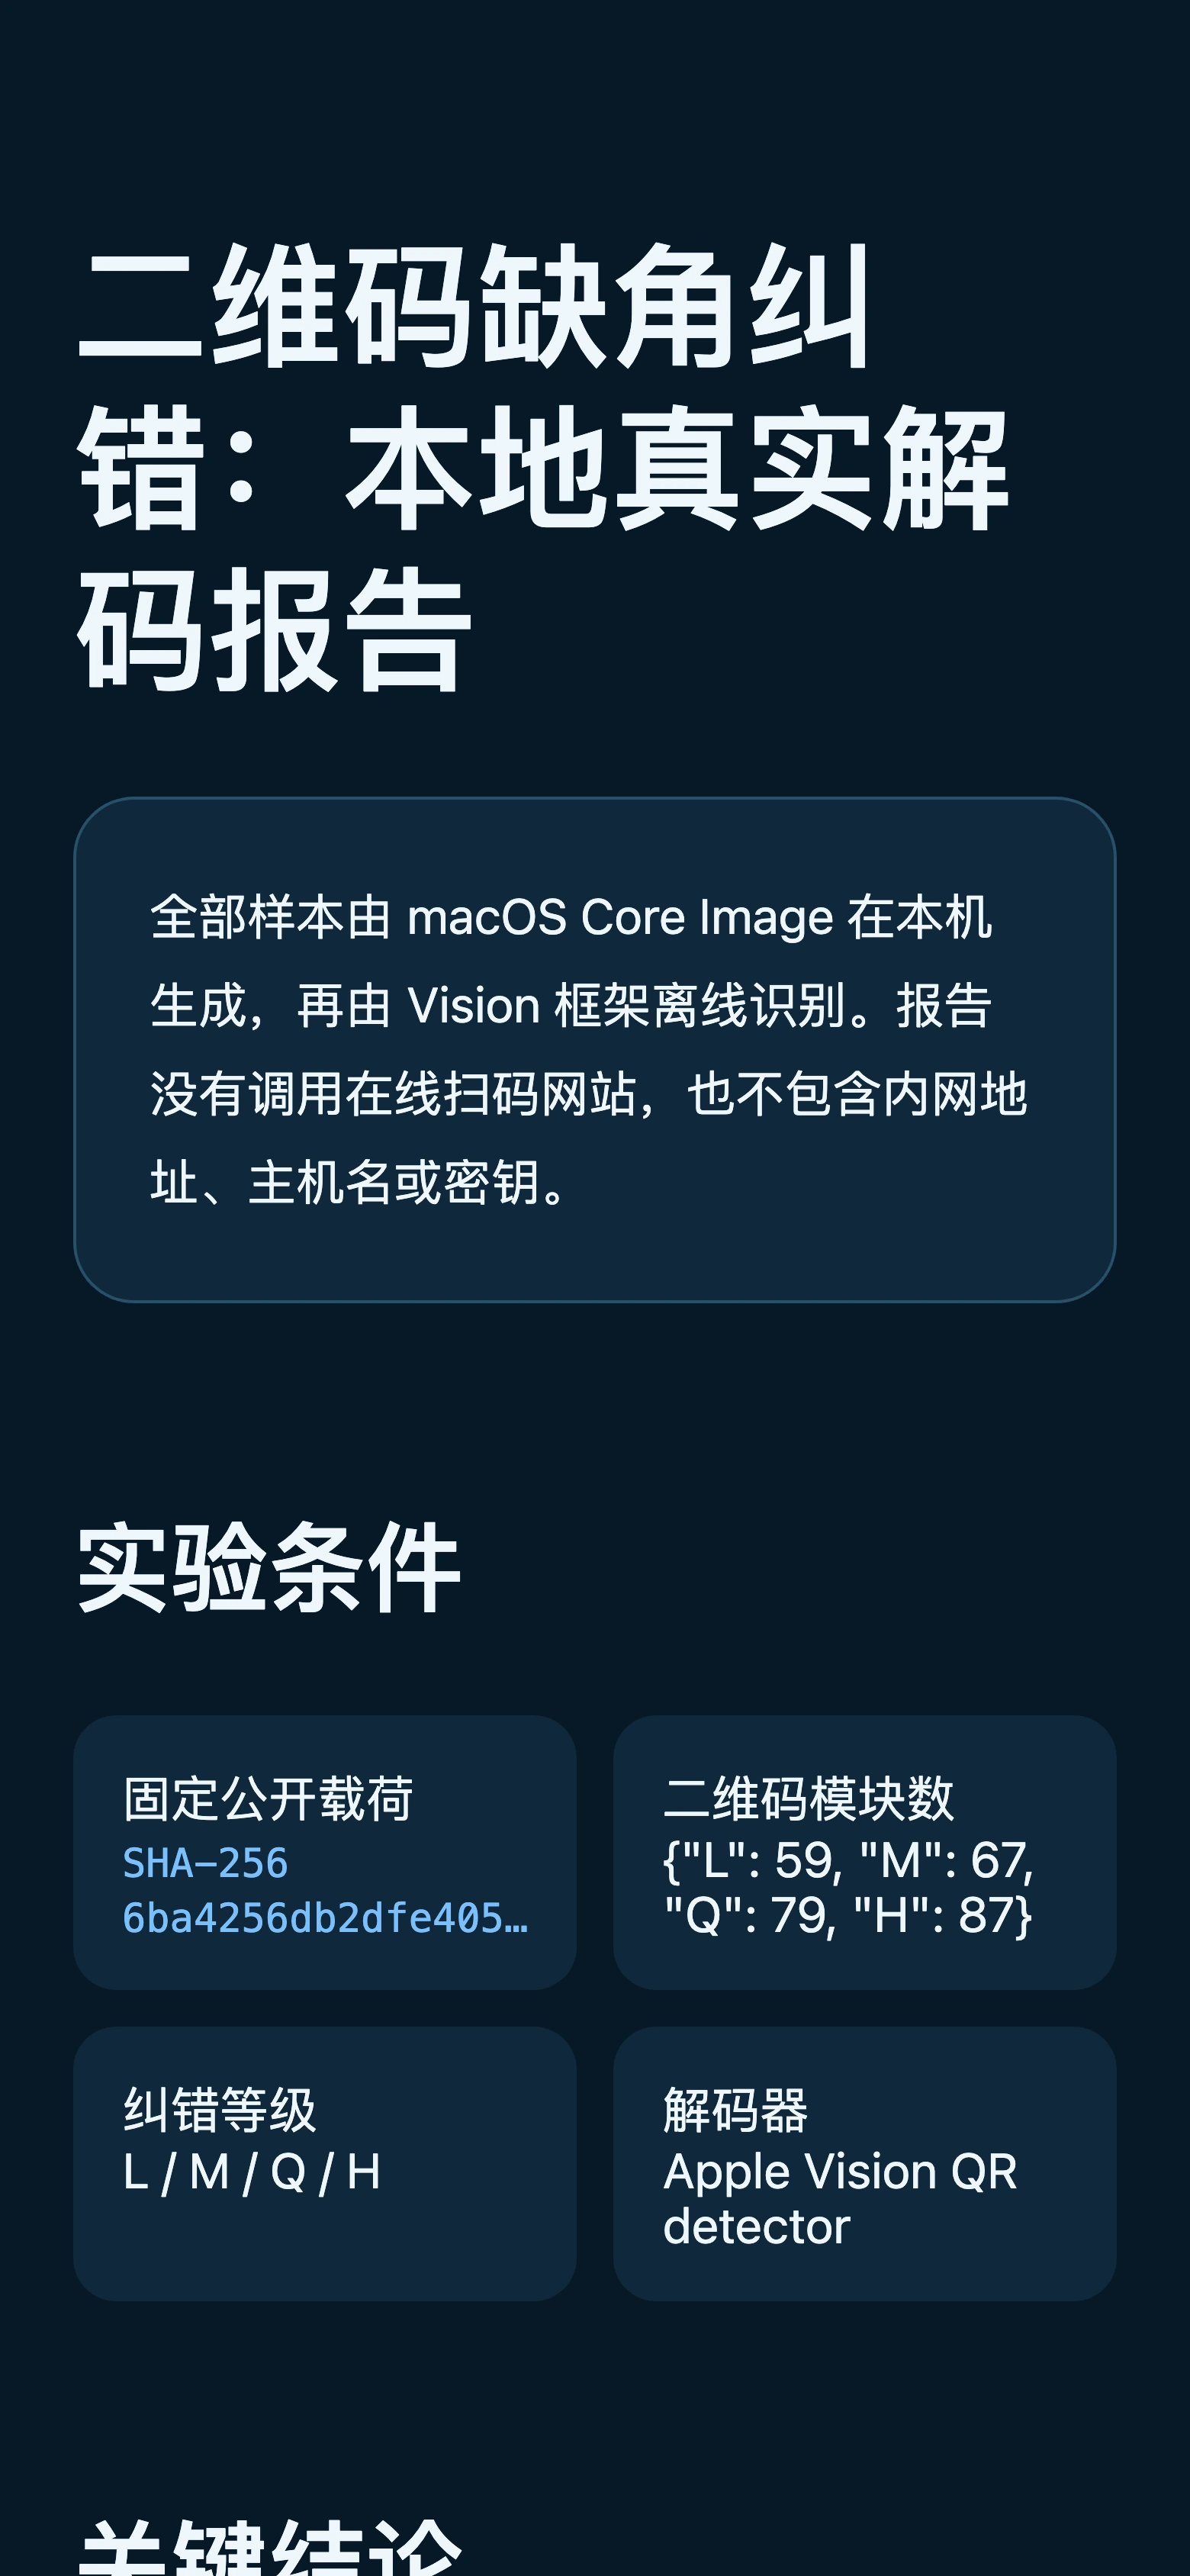
Figure 6: A real 390-pixel mobile viewport screenshot showing the experiment conditions, payload digest, and decoder.
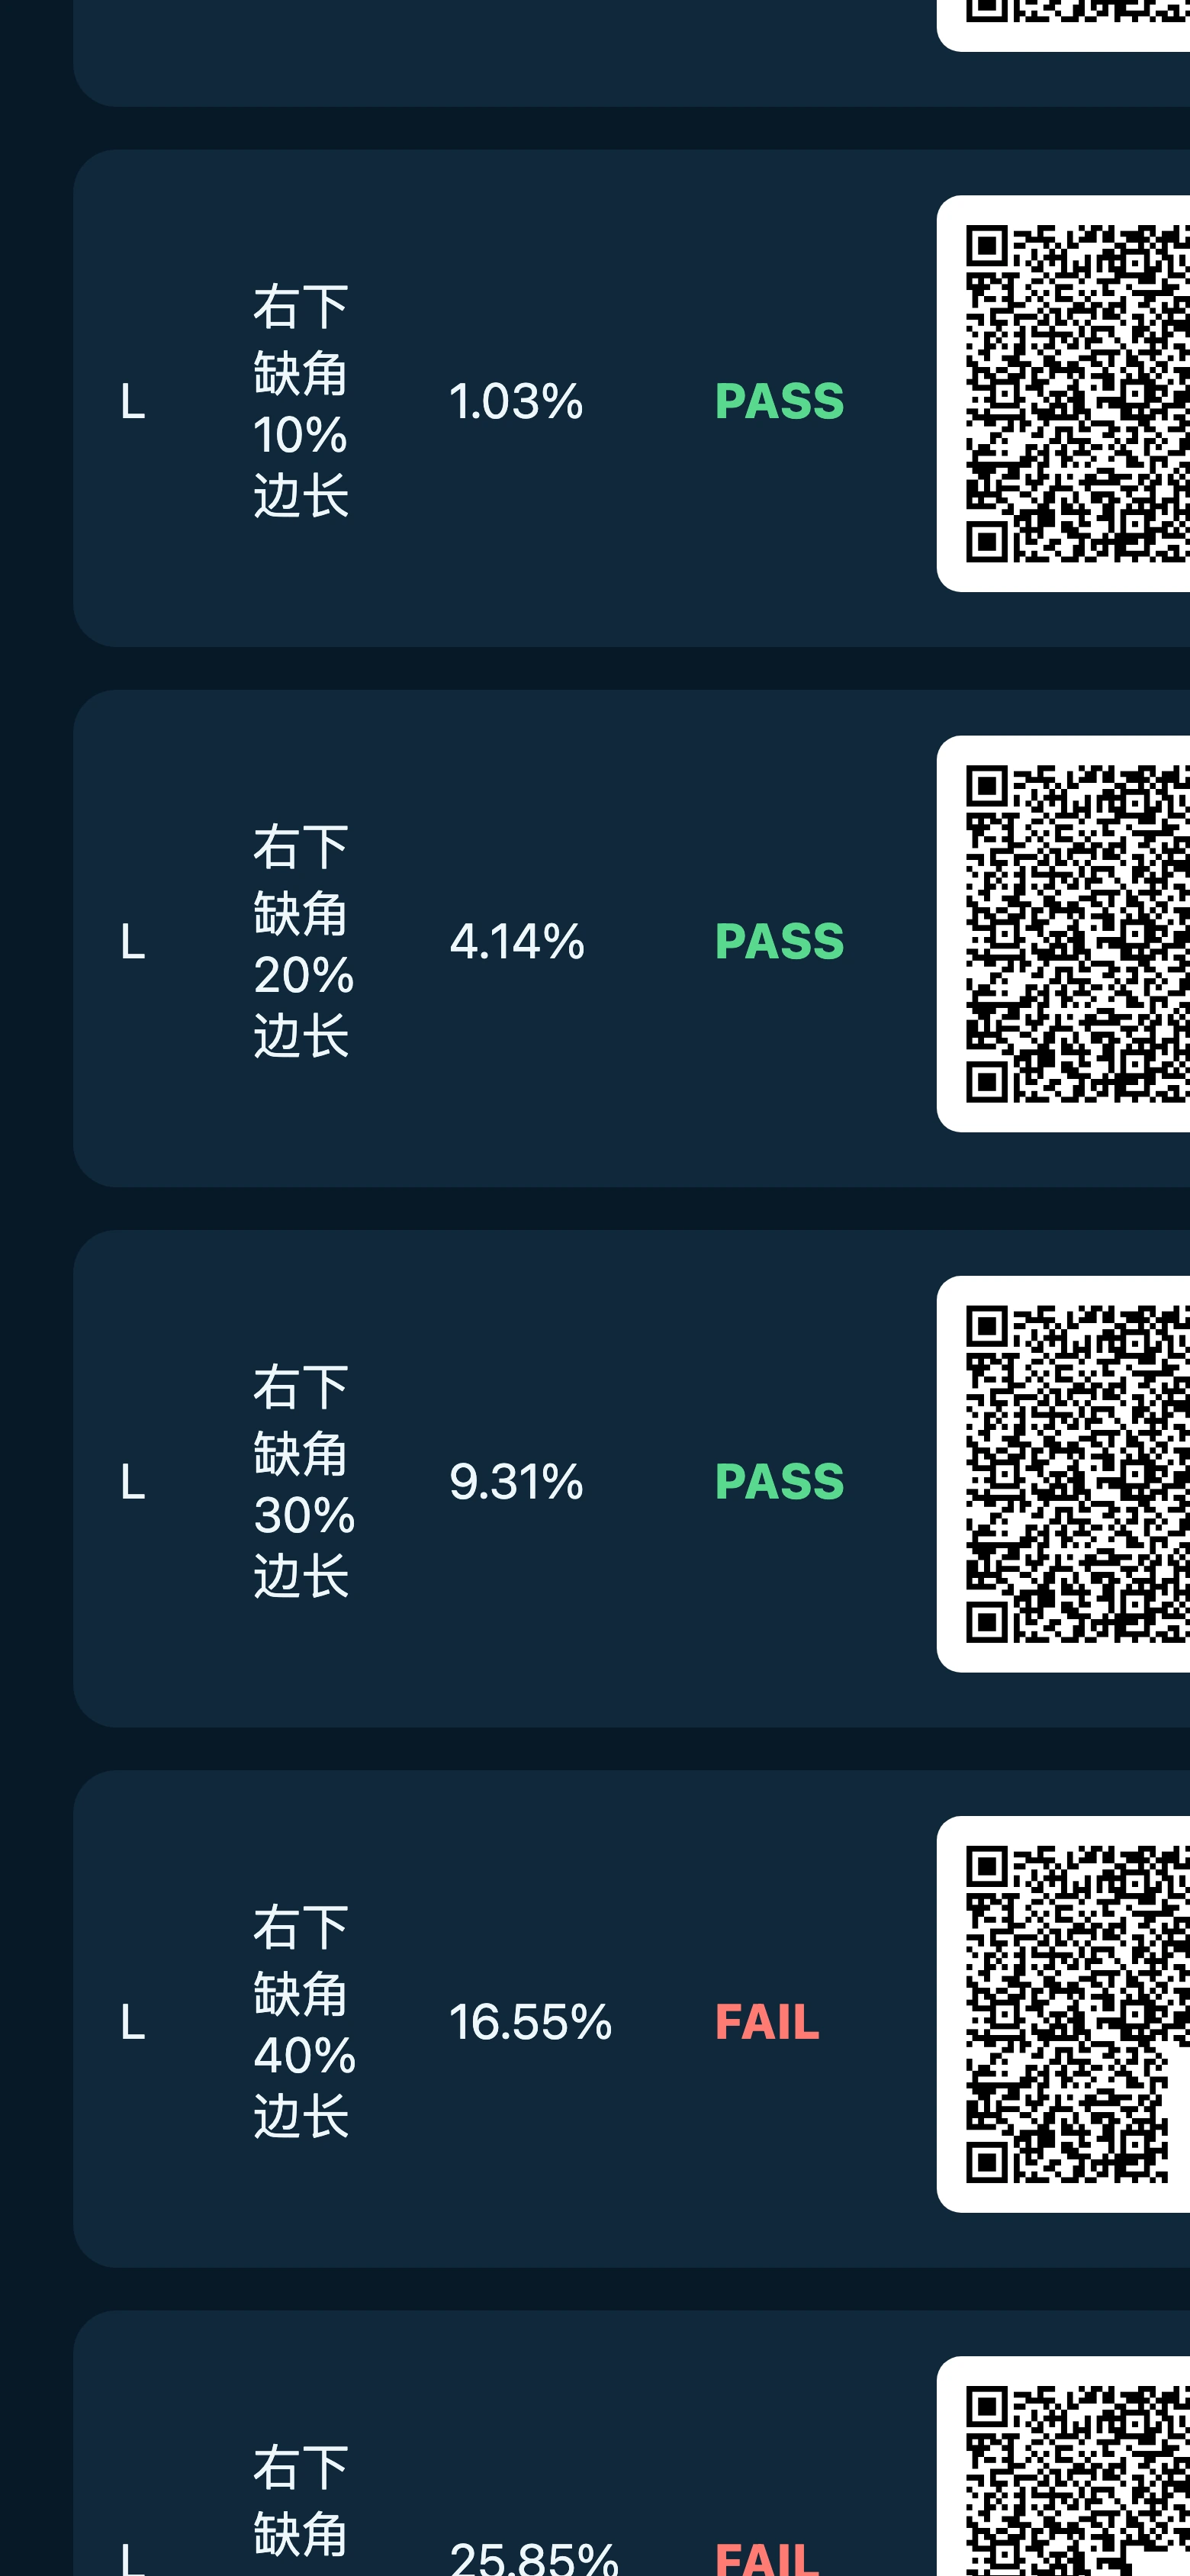
Figure 7: A real screenshot emphasizing that image-area percentages and codeword correction capacity are different measurements.

Figure 8: A real screenshot of the per-sample table. PASS and FAIL come from the local Vision output.
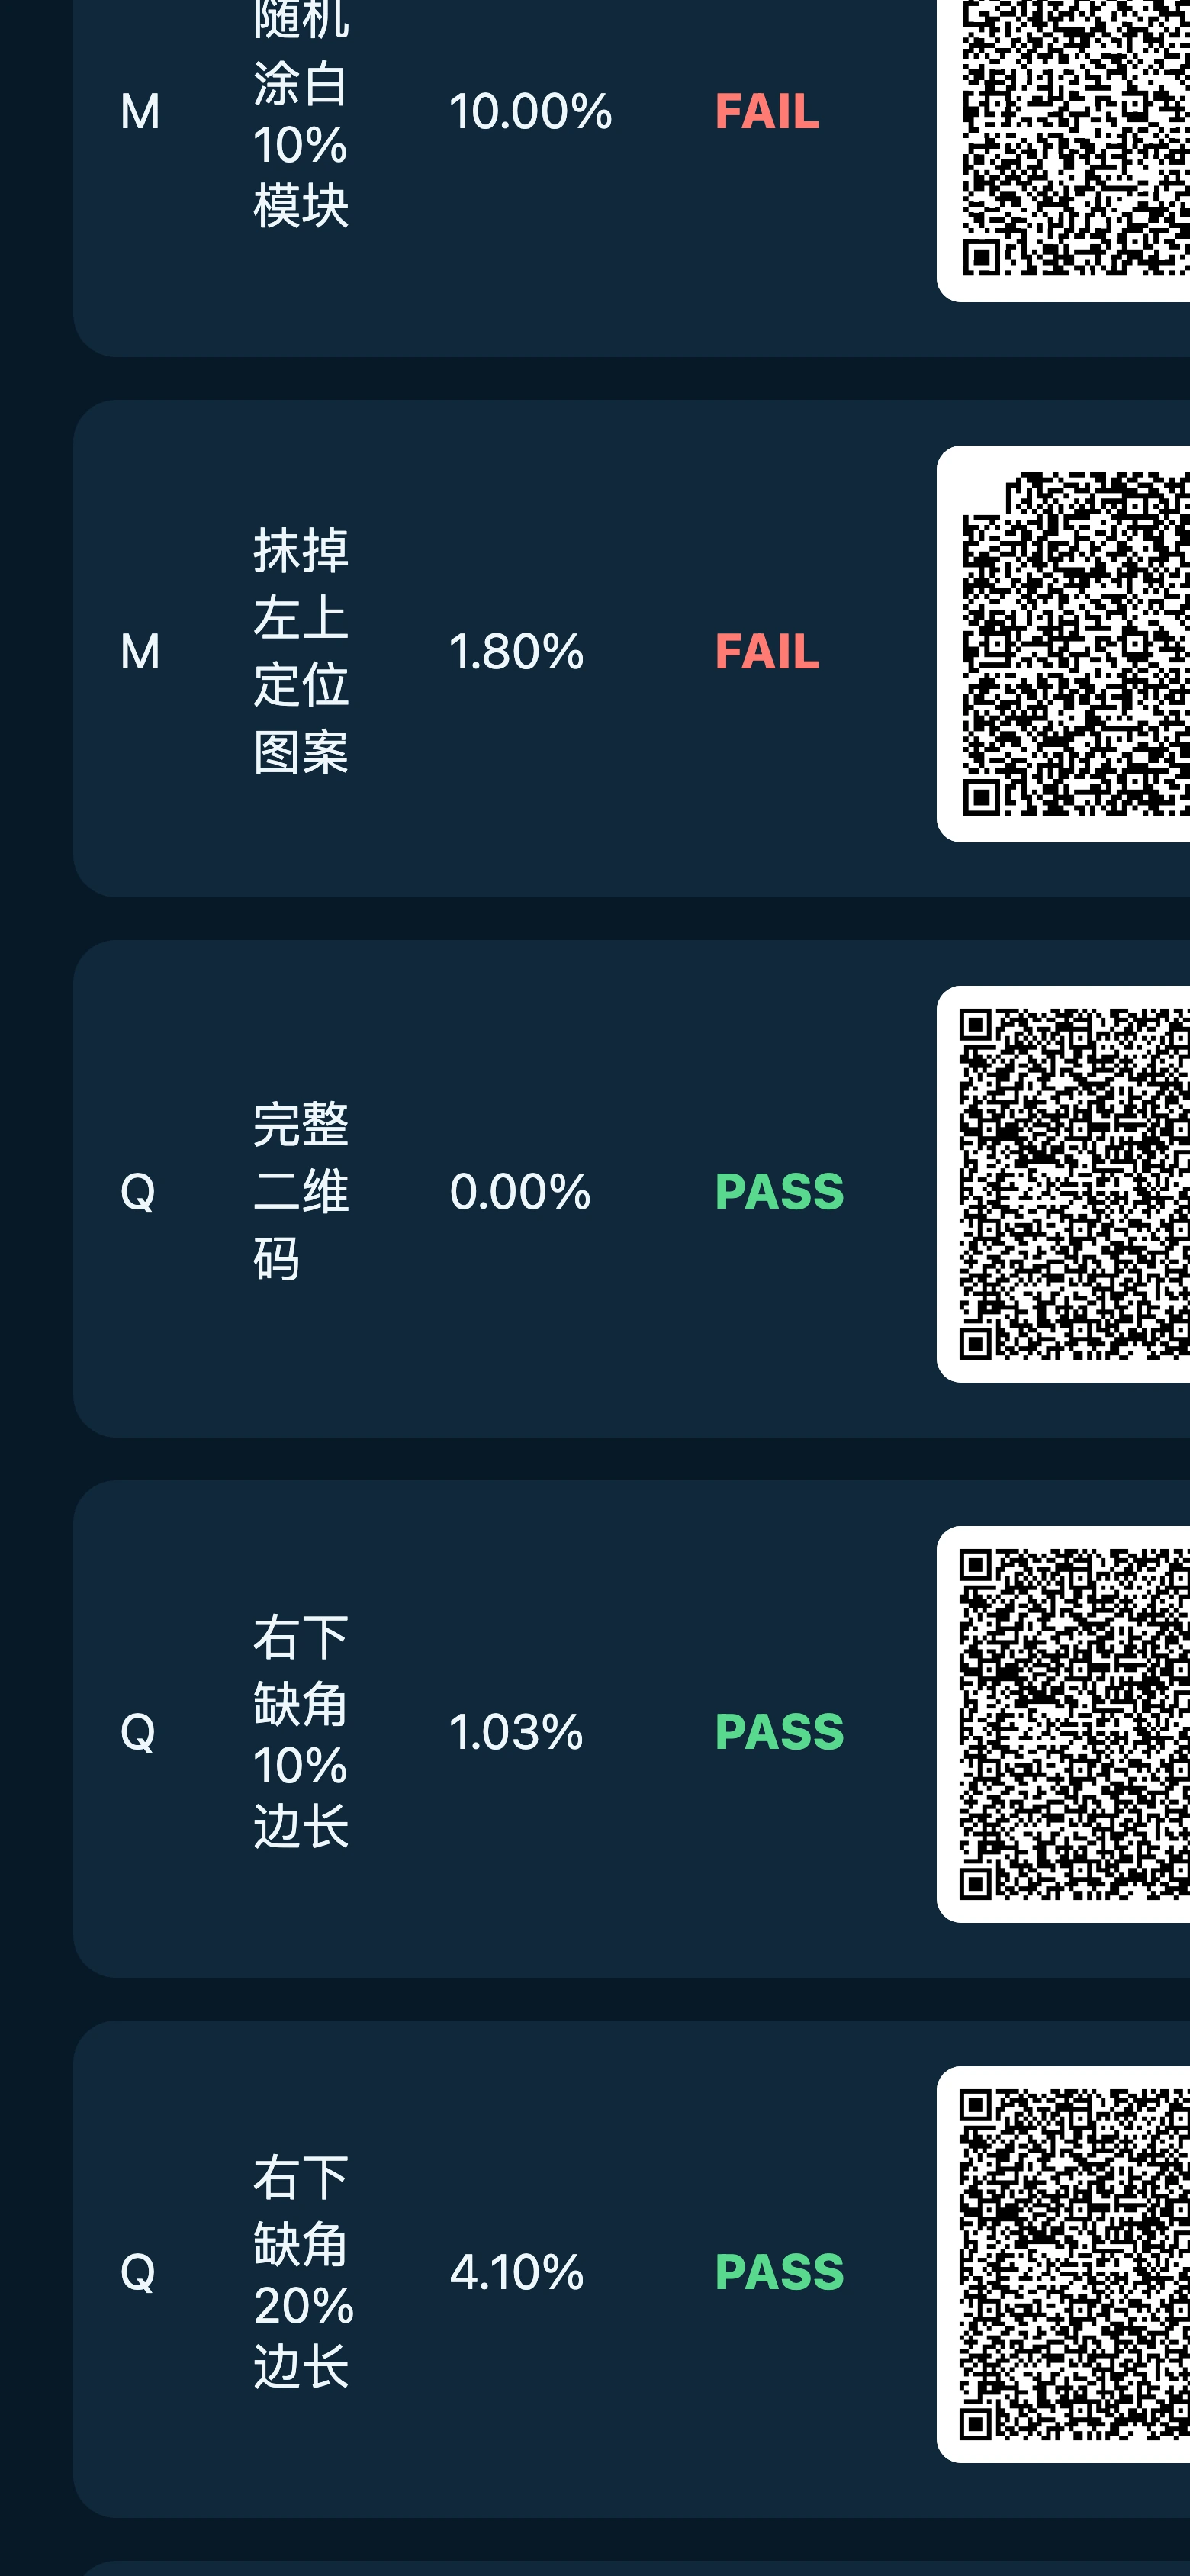
Figure 9: A real screenshot showing the QR samples embedded in the experiment report.
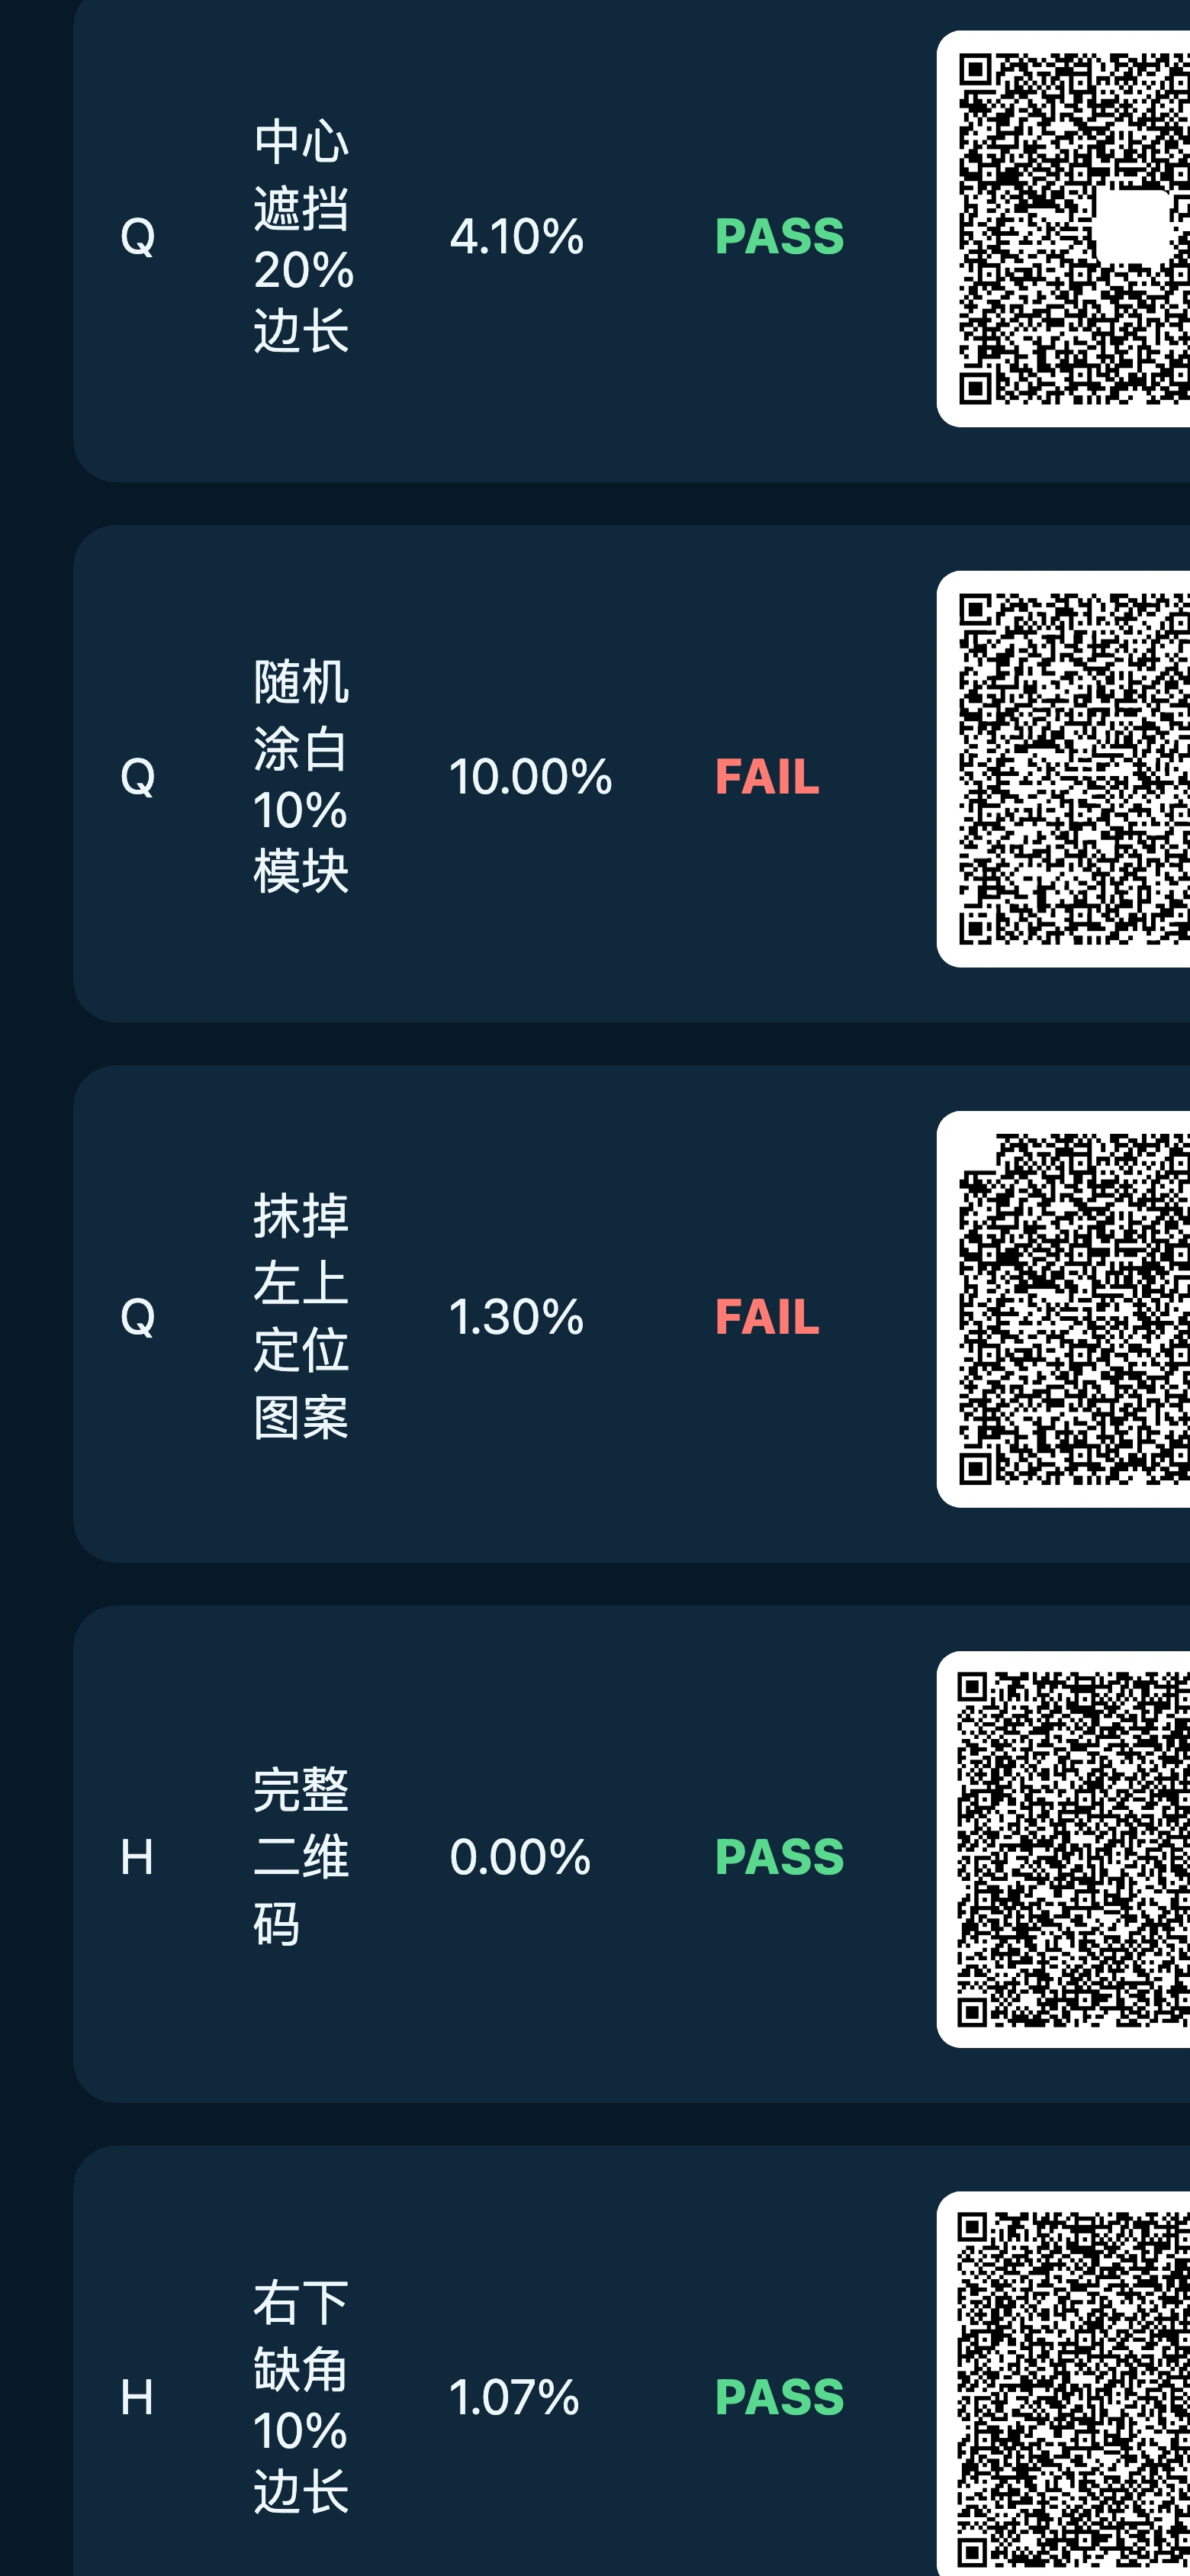
Figure 10: A real screenshot showing the L/M/Q/H comparison record.
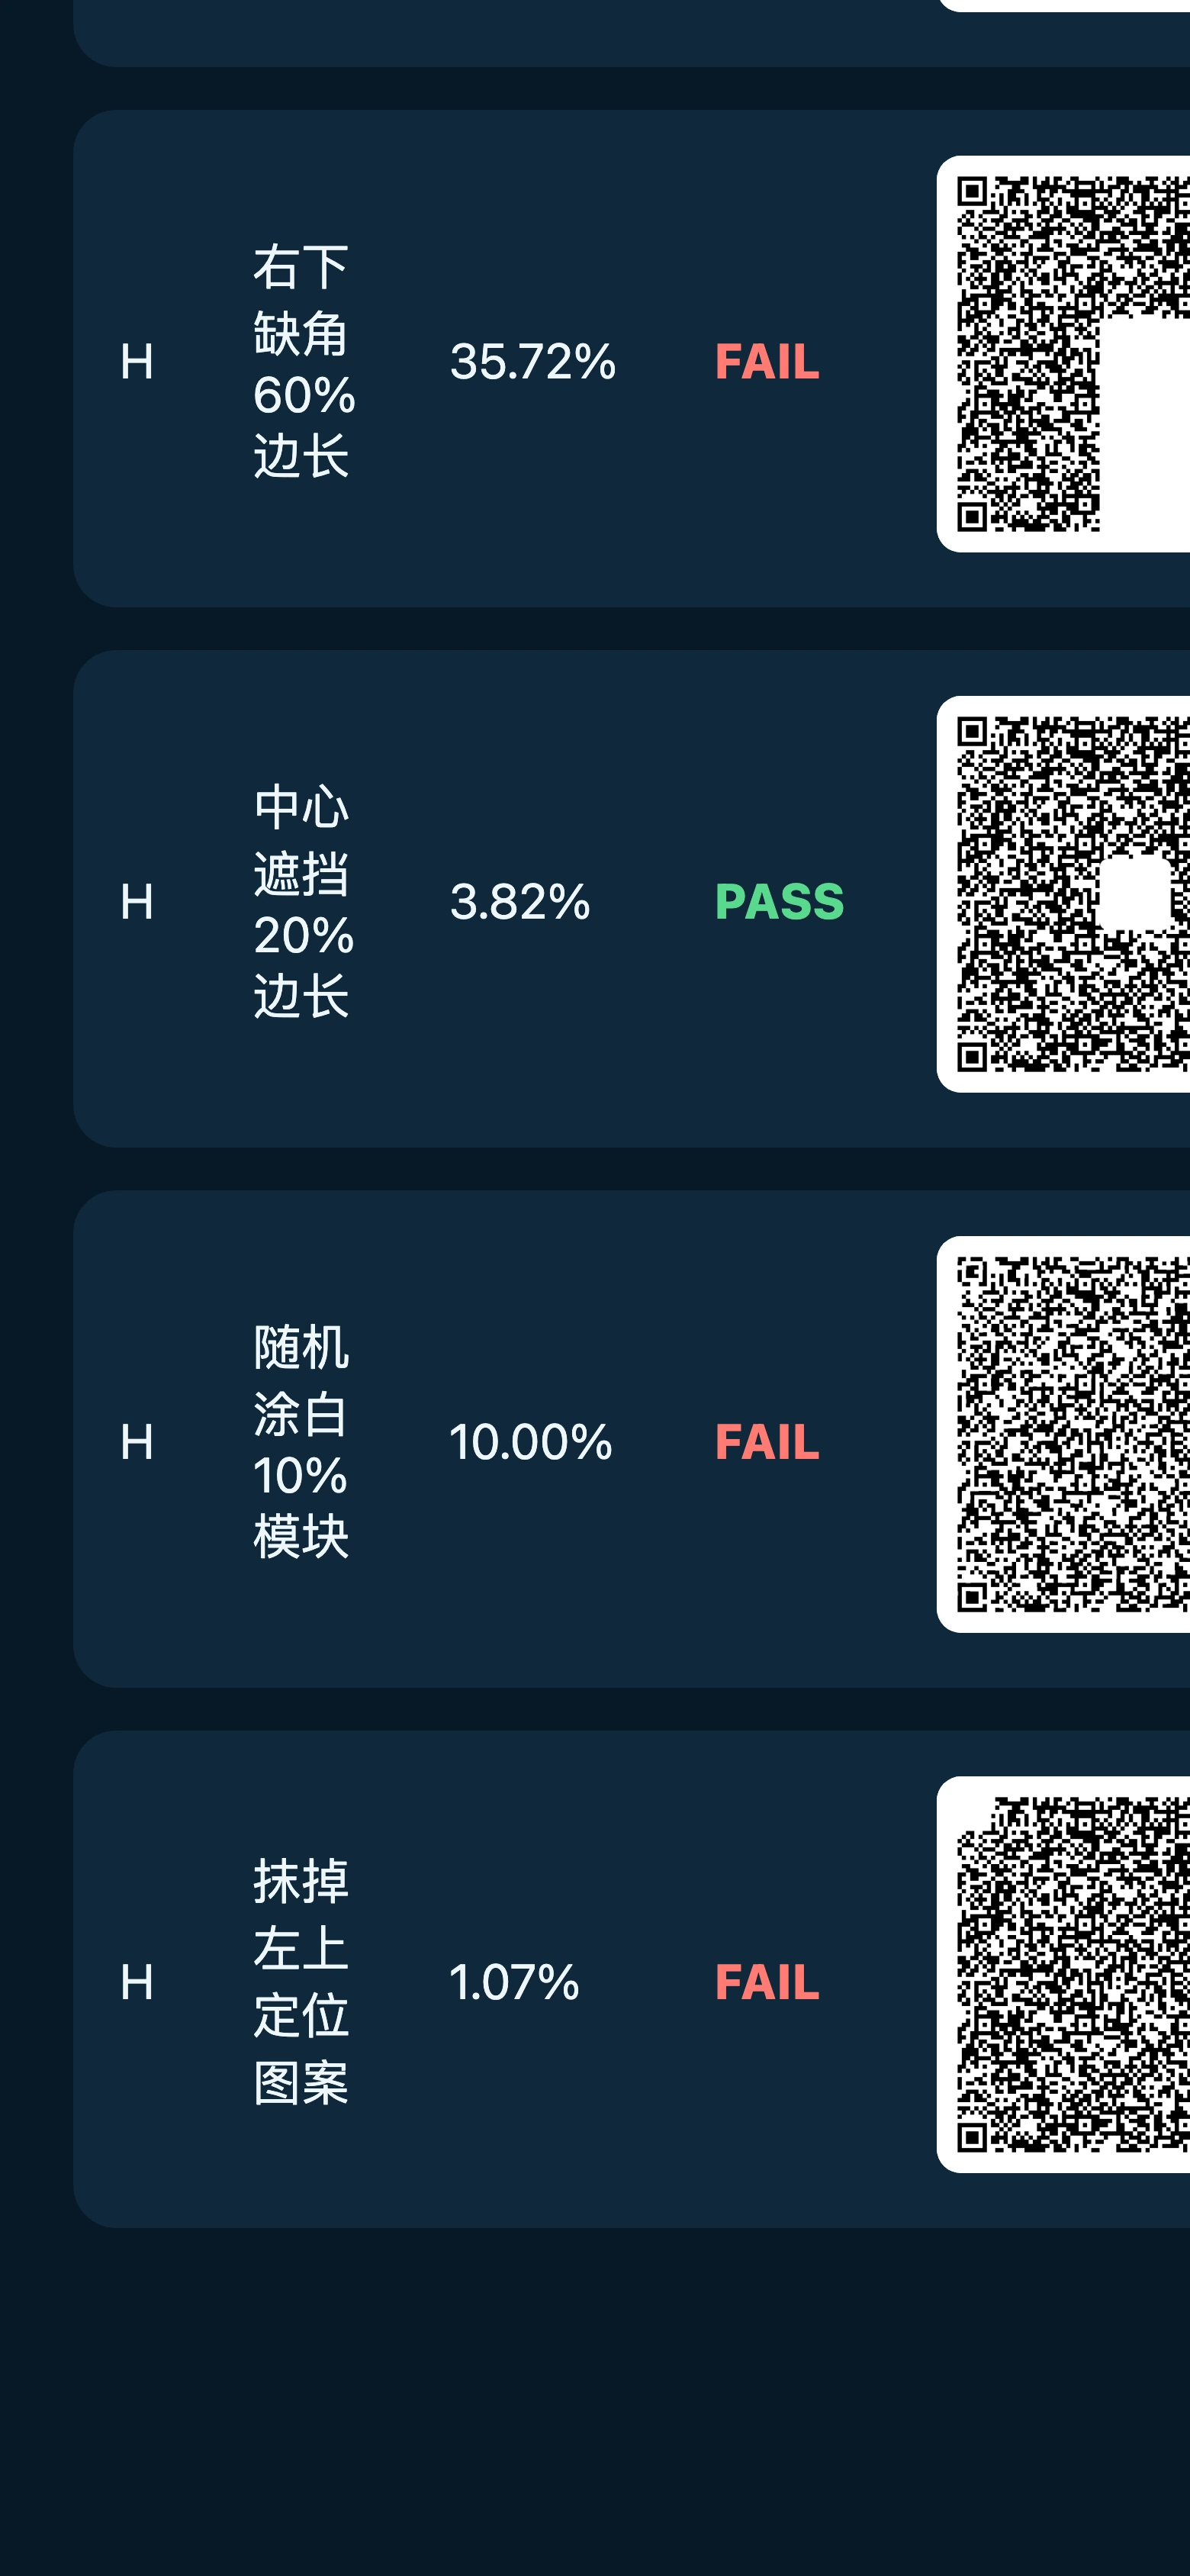
Figure 11: A real screenshot from the lower part of the report, included as an independent piece of experimental evidence.
What regions make up a QR code?
Thinking of a QR code as a small city is more useful than thinking of it as random black dots.
- The three large squares are landmarks. They help the camera find position and orientation.
- Nearby modules carry format, version, and alignment information.
- Much of the remaining region carries data and error-correction codewords.
- A quiet white border normally separates the symbol from surrounding graphics and helps detection.

Figure 12: A teaching diagram of QR regions. The colors are explanatory and do not mean that real QR symbols use these fixed colors.
DENSO WAVE’s version guide describes QR versions from Version 1 at 21×21 modules through Version 40 at 177×177 modules. Higher versions carry more modules and can store more data, but their patterns become denser and more demanding to print, display, photograph, and scale.
This explains why “one missing corner” is not a stable measurement. A small QR and a large QR can lose very different amounts of information from the same visual-looking cut. The relative size of the cut, the region it hits, and whether the camera can still locate the symbol all matter.
Reed–Solomon correction: extra clues for recovering missing codewords
Reed–Solomon coding is one of the main mathematical tools used to add redundancy to QR data. It does not simply paste a complete duplicate of the original sentence into the symbol. Instead, the encoder treats data as symbols and calculates check symbols with a defined algebraic relationship to them.
Here is the dictation analogy. A teacher reads, “Today the weather is sunny, and I went to the park with my classmates.” You may lose a few characters, but the surrounding sentence gives context. “Weather” narrows the likely missing word; “went to the park” narrows what can appear before it.
QR correction is stricter than common-sense guessing. The decoder tests which codeword combinations satisfy the mathematical relationships represented by the check symbols. That makes it possible to correct errors and, in some cases, recover missing symbols.
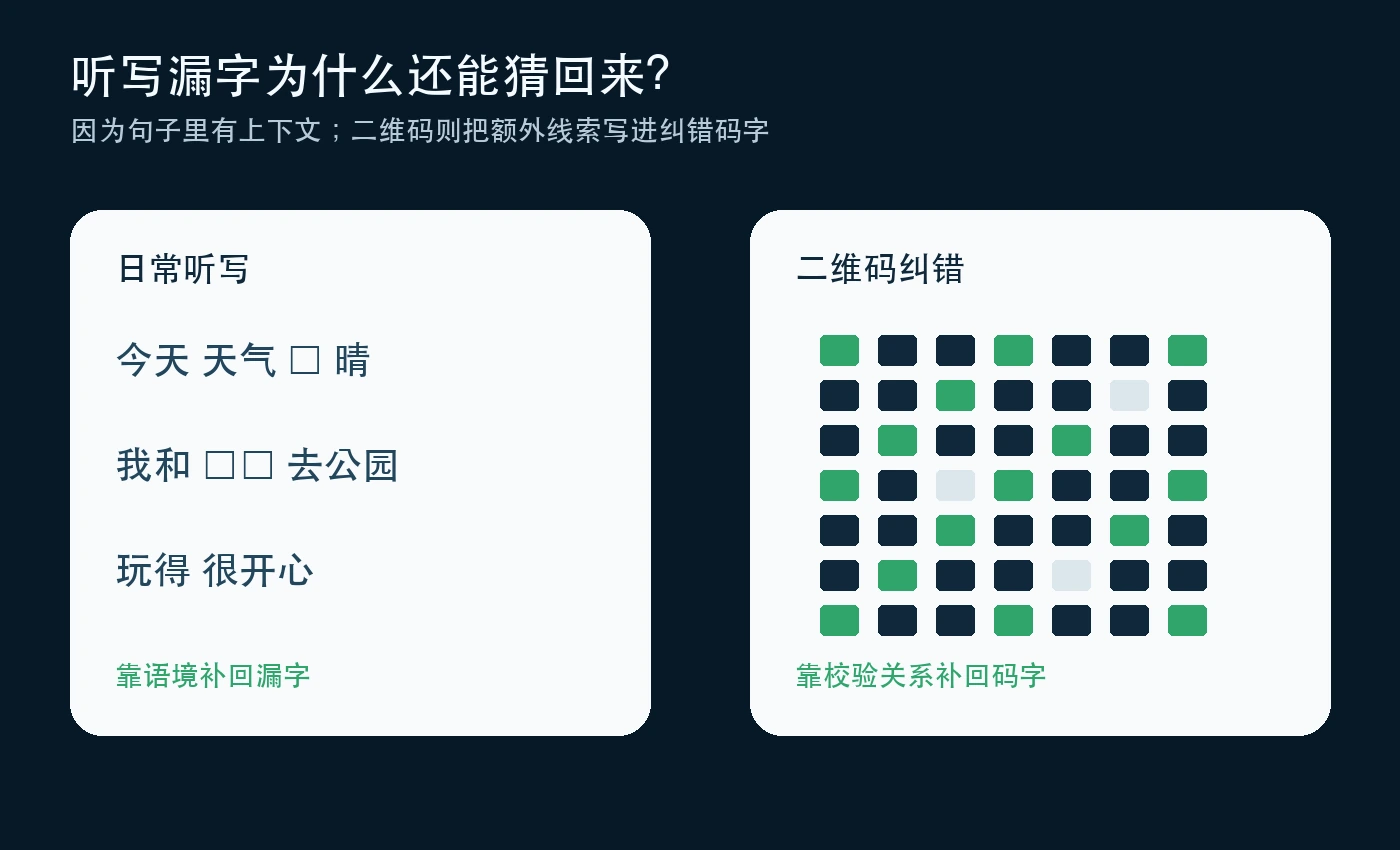
Figure 13: Context helps reconstruct missing dictation characters; algebraic relationships help reconstruct QR codewords.
Why QR data is interleaved
QR codewords are not always placed as a simple left-to-right text stream. The placement follows a defined path, and blocks are interleaved. This can spread the effect of a long scratch across multiple codeword groups instead of concentrating all errors in one consecutive chunk.
That is why a visible line on the picture cannot be converted directly into “this many characters are lost.” Sampling, masking, placement, and interleaving determine which codewords are affected. A real decode or a standards-based calculation is needed to know whether the correction budget has been exceeded.
What do L, M, Q, and H mean?
The four levels trade payload capacity for redundancy. DENSO WAVE gives approximate restoration rates of 7% for L, 15% for M, 25% for Q, and 30% for H of total codewords. Its explanation also notes that a QR codeword is an 8-bit unit.
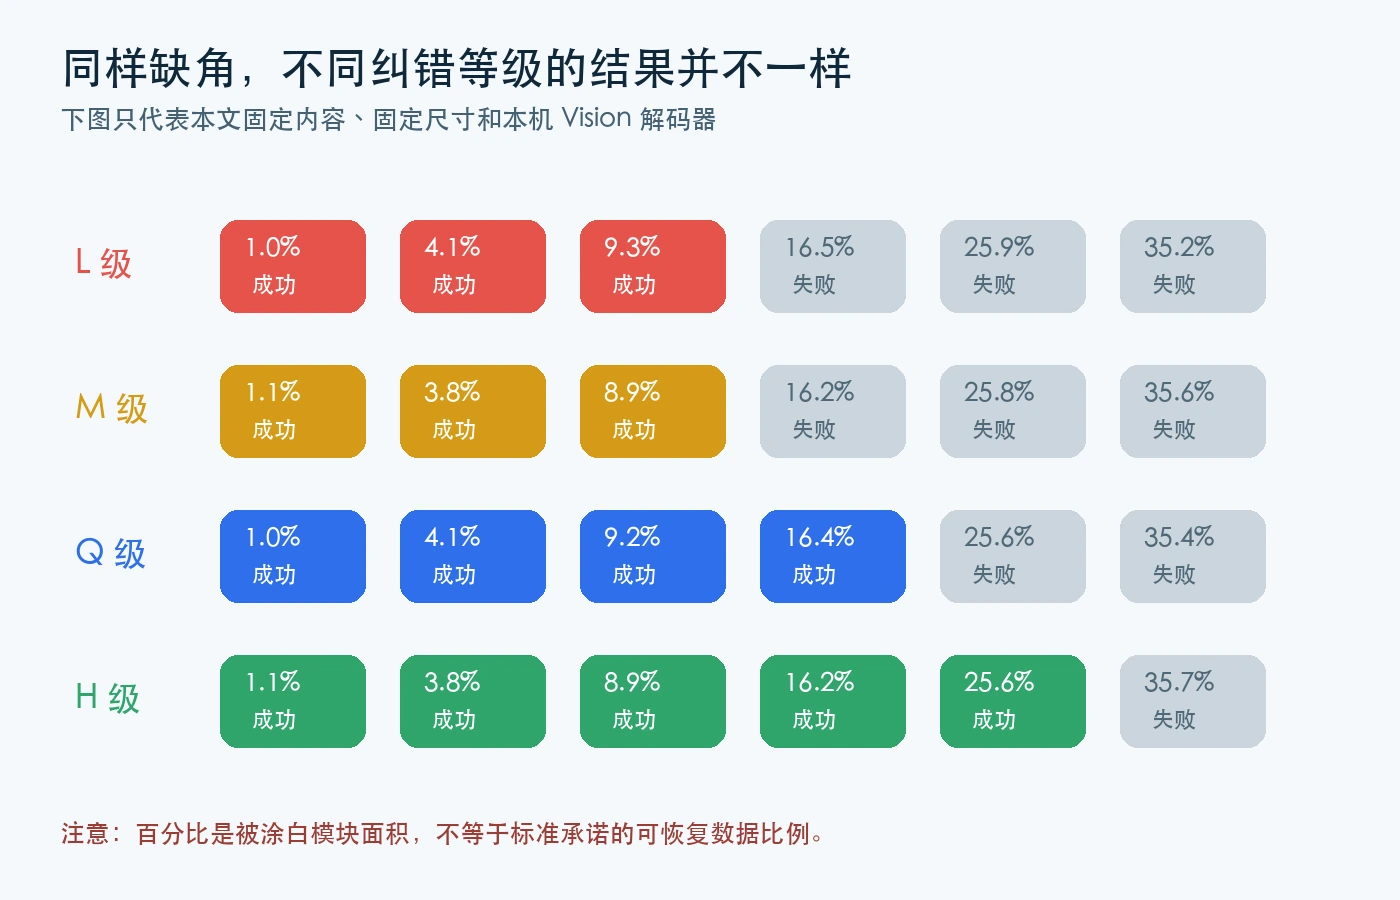
Figure 14: The level comparison from this experiment. The colors show pass/fail for this sample and are not universal thresholds.
Three qualifications are essential.
First, “30%” is not a picture-area guarantee
The approximate H-level figure describes codeword correction capacity, not an arbitrary percentage of the visible image. Finder patterns, the quiet zone, and the data region have different jobs. The same area of damage can produce opposite outcomes depending on where it lands.
In this experiment, the H sample survived a lower-right cut covering about 25.8% of module area, while removing a top-left finder pattern covering only about 1.8% caused failure. Those two outcomes are a direct warning against using area percentage alone.
Second, more redundancy costs capacity or size
Redundancy is not free. A higher correction level reserves more codewords for checks. For the same payload, the symbol can require more modules; for a fixed physical size, the usable data capacity can fall.
It is like bringing more scratch paper and doing more checks before an exam: recovery becomes easier, but the schoolbag gets heavier and there is less room for the original notes.
Third, the decoder matters
Different phones, cameras, lighting conditions, scaling factors, and decoding libraries can produce different results from the same damaged image. The PASS/FAIL values here are Apple Vision observations under fixed conditions. They do not promise the same result for every Android device, app, printer, or viewing distance.
Root cause: three lines of defense
The full pipeline usually has three defenses:
Find the symbol. Finder patterns, geometric ratios, and the quiet zone let the scanner identify the QR code, correct perspective, and estimate module size.
Read the remaining modules. The camera samples dark, bright, blurry, and reflective regions; the decoder uses format, version, and mask information to interpret the modules.
Repair wrong or missing data. The decoded codewords enter the Reed–Solomon stage, which uses check symbols to detect and correct errors.
If the first defense fails, the latter two may never run. If the third defense runs out of budget, accurate positioning cannot reconstruct the original payload.
How to design a more durable QR code
The same principles are useful for posters, labels, screens, and equipment tags.
- Do not cover the three finder patterns. If a logo is necessary, the center is usually a safer candidate, but the real device still needs testing.
- Keep a clean quiet zone. Do not press borders, text, or decoration against the outer edge.
- Choose correction for the environment. Clean indoor displays may use M; outdoor, logistics, or factory labels may justify Q/H, at the cost of size or capacity.
- Test more than the high-resolution source. Test printing, reduction, photographing, glare, low brightness, blur, and partial obstruction.
- Define “scans” as repeatable. Use multiple devices, distances, and angles. One successful scan is not a reliability test.
For payment, login, device provisioning, or ticketing flows, add application-level expiry, signatures, permissions, and retry paths. Error correction can help recover the payload; it cannot prove that a destination is safe or prevent a QR sticker from being replaced.
Q&A
Why can a phone scan a QR code after one corner is gone?
Because the damage may be in the data region, while redundant codewords still provide enough information to reconstruct the missing part. The scanner must also retain enough finder patterns and geometry to locate the symbol.
Does H level mean that I can cover any 30% of the QR image?
No. The 30% figure is an approximate statement about total codeword correction capability, not a license to paint over any 30% of the picture. A finder pattern, quiet zone, severe glare, or sampling failure can break the pipeline before correction begins.
Why is a center logo often safer than a logo in a corner?
The three corners contain finder patterns that locate and orient the QR symbol. The center more often contains data and correction modules. A center logo still needs real-device testing; it is not automatically safe.
Why can my phone scan it while another phone cannot?
Both devices may be behaving normally. Focus, exposure, image enhancement, camera resolution, decoding algorithms, and displayed symbol size all matter. Production acceptance should include the weakest target device, not only the phone that happened to succeed first.
If QR codes have error correction, do I still need backups and retries?
Yes. Correction has a limit, and printing, glare, perspective, and dirt can make a symbol unreadable. Important workflows should offer manual entry, a fallback link, or a way to regenerate the code.
Is Reed–Solomon used only for QR codes?
No. It is a general family of error-correction techniques used for grouped symbol errors and burst errors in areas such as optical media, communications, and storage. QR codes simply make the idea visible in everyday life.
References
- DENSO WAVE: Error Correction Feature
- DENSO WAVE: Information Capacity and Versions
- DENSO WAVE: QR Code Standardization
- ISO: ISO/IEC 18004 QR Code standard entry
The most interesting lesson is not that a QR code can “magically” survive damage. It is that a system does not need every detail to remain perfect if it stores verifiable backup clues in advance. Context helps us fill in a few missing dictation characters; algebraic redundancy helps a decoder recover a few missing codewords. Good engineering does not assume that nothing will go wrong. It makes recovery possible when something does.