Computers Rarely Break “Out of Nowhere”: Read Logs Like a Detective
The short conclusion
Computers rarely fail without leaving a trace. A disk gradually fills up. A service emits warnings before it exits. A DNS lookup fails before a browser reports a timeout. A process starts and stops several times before a user sees a broken page. The practical skill is not to reinstall everything after seeing a red error. It is to ask five detective questions: When did it happen? Which object was involved? How serious was it? What happened before and after it? Can the result be verified after the fix?
This article explains logs as a computer’s diary instead of presenting them as mysterious engineering jargon. It uses real collection output from Windows 11, Ubuntu 26.04, and macOS 26, provides three native read-only collectors, and shows how to give the same evidence-first workflow to an Agent. A child should understand most of the story; an engineer can still reuse the commands and the reasoning pattern.

Figure 1: A computer is not a mysterious black box. It is closer to a room that records its footsteps and keeps a diary.
Why a computer can look as if it failed “suddenly”
When a child asks, “It worked a minute ago. Why is it broken now?”, adults often answer, “The system probably glitched.”
Most systems do not actually fail without a story. Imagine a school with a detailed duty log:
- the guard records when a door opens;
- teachers record when a class starts and stops;
- the warehouse manager records which shelf is full;
- the bus dispatcher records whether an address can be found.
Those records are logs. They are not primarily for showing off technical vocabulary. They are written for the future: when something goes wrong, you can reconstruct the story from time, object, and result.
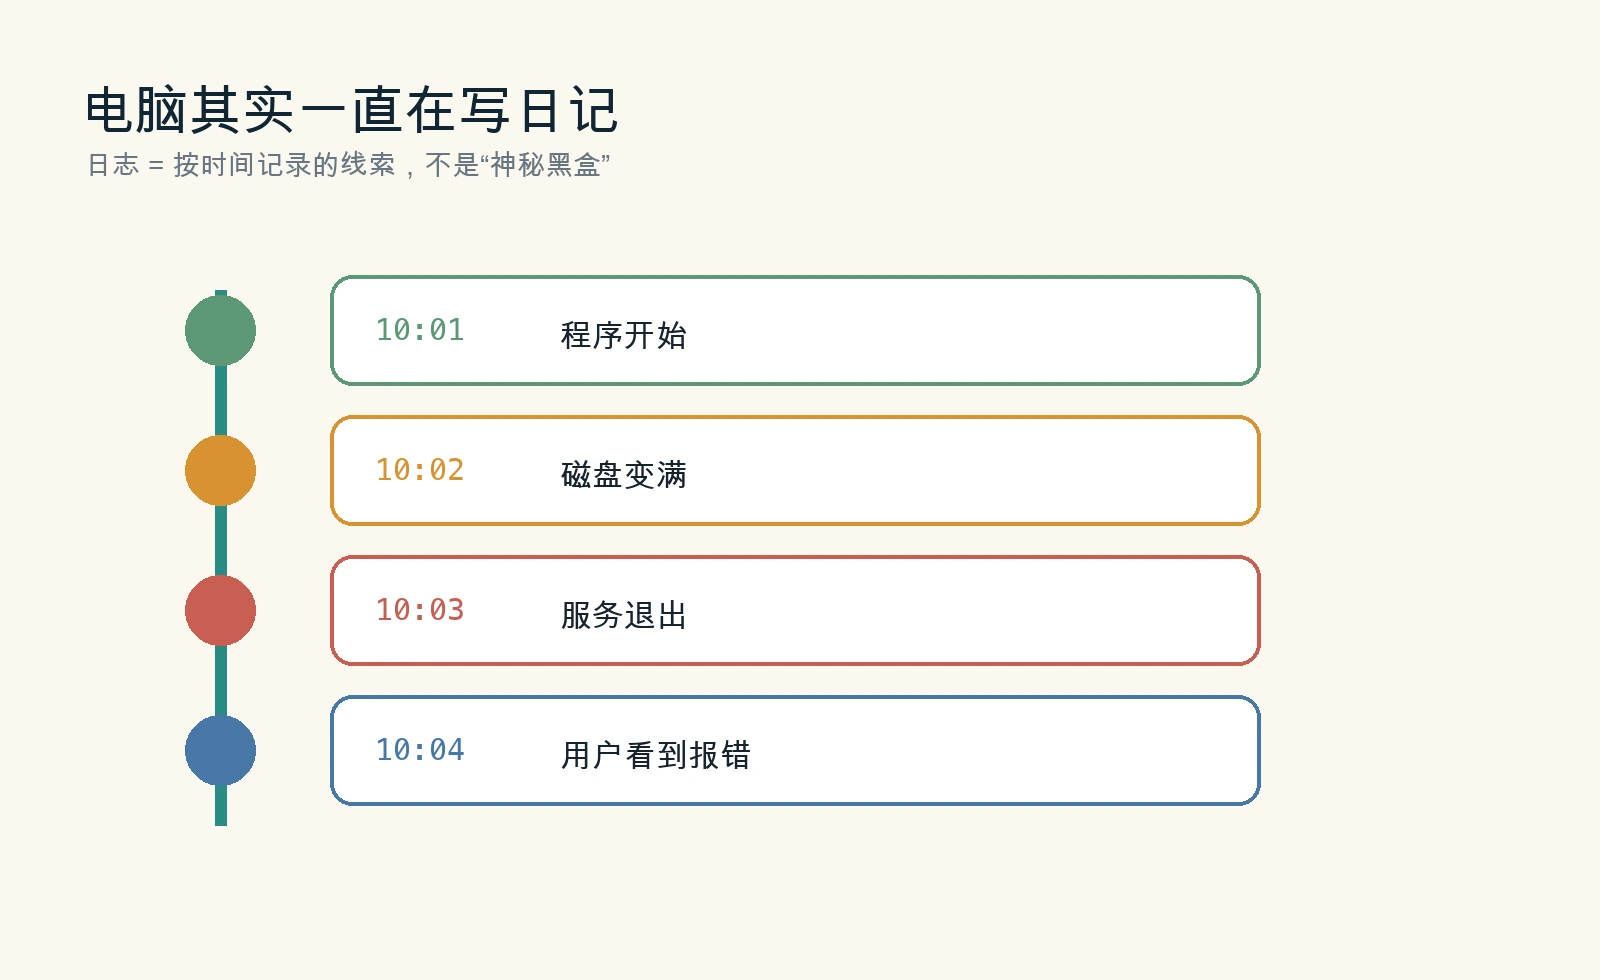
Figure 2: Space can decline first, a write can fail next, and a page can time out last. The last visible symptom is not necessarily the root cause.
What a log usually tells you
Time: the order of events
Logs normally contain timestamps. A timestamp is like the date on a homework page or the clock in the corner of a security recording. Its value is not that it looks formal. Its value is that it gives you order.
If a page timed out at 10:04 but the disk was already nearly full at 10:02, “the network is broken” may only be the surface. The real story might be that a program could no longer write a file at 10:02, a service exited at 10:03, and the user finally saw a timeout at 10:04.
Object: who is speaking
A log usually names its source: a Windows event provider, an Ubuntu systemd unit, a macOS process, or a module inside an application.
That is the difference between hearing “someone closed the door” and knowing which student did it. Once the source is known, the search space becomes smaller: disk, DNS, SSH, database, browser, or application?
Severity: a red light is not the end of the investigation
INFO can mean “this is what I did.” WARNING means “there may be a risk.” ERROR means “this action failed.” FAULT often points to a more serious system-level failure.
Severity is a useful priority signal, not proof of a root cause. Some programs log an ordinary retry as ERROR; some important clues are written as ordinary information. Severity is like a traffic light: a red light tells you where to look first, but you still need to understand the traffic around it.
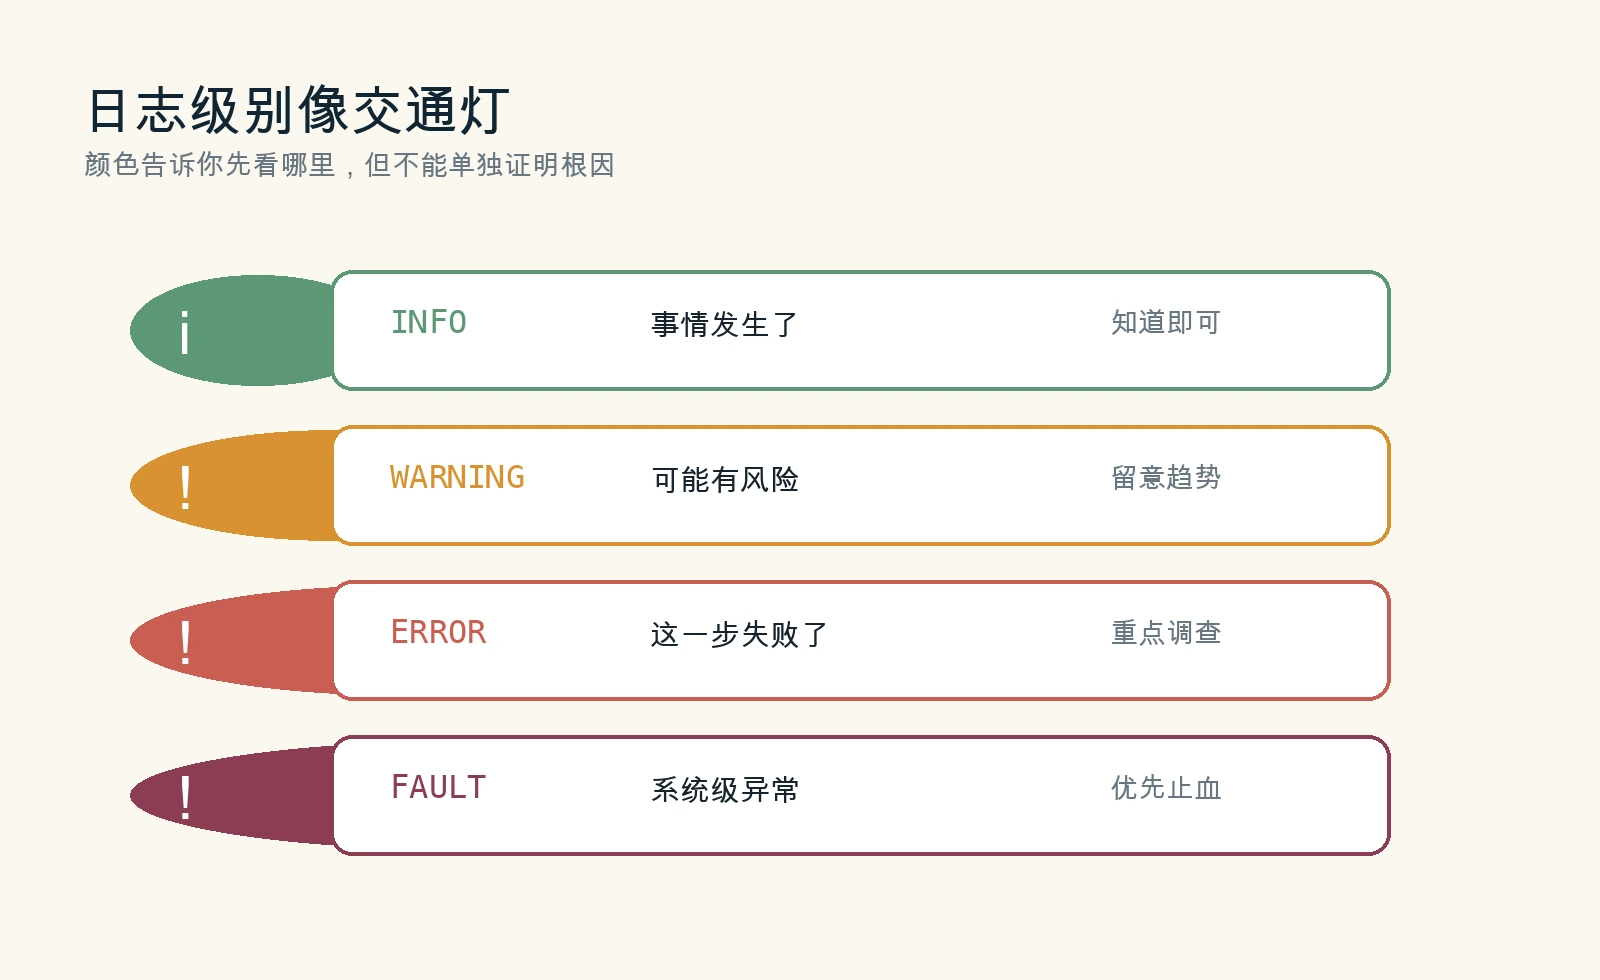
Figure 3: A severity level is a navigation sign, not a verdict. An ERROR is a clue that needs context.
A five-step troubleshooting method a child can learn
Start with time
Do not ask, “Why has this been unstable lately?” Ask, “When did I first see the problem?” A narrow time range is easier to read.
“From 3:00 p.m. to 4:00 p.m. today” is usually more useful than dumping several months of logs onto the table. Moving an entire library to the desk does not make you more careful; it only hides the important book.
Identify the object
If a browser cannot open one page, start with the browser, DNS, network interface, listening port, and target service. Do not immediately search every system error.
If a scheduled job failed on a server, identify the job, service, process, and log source before searching.
Read severity, but do not worship it
Start with ERROR and FAULT, then add the WARNING and INFO events from a few minutes before and after. The root cause is often written before the final red error appears.
Turn scattered lines into a timeline
A single log entry is a sentence. A sequence of entries is a story. Sort events by time and label them “first,” “next,” “chain reaction,” and “user-visible symptom.” A simple causal chain often appears.
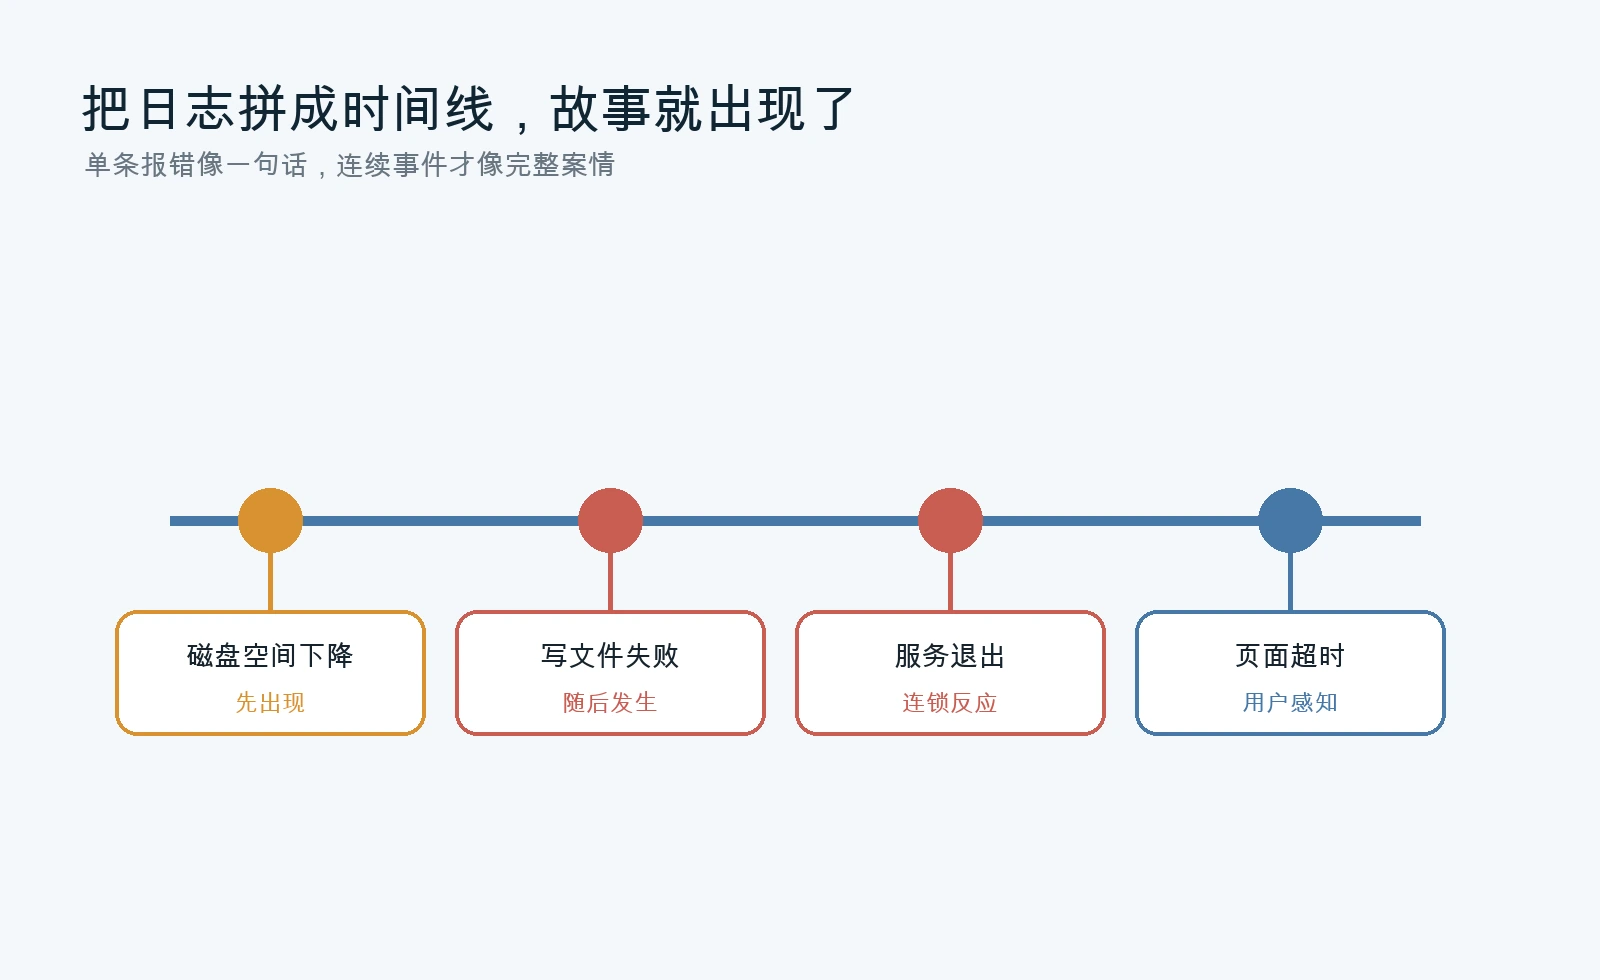
Figure 4: A timeout may be the final experience, not the first cause.
Verify after the fix
Running a command is not the same as proving a repair. After a change, repeat the action: start the service again, resolve the name again, write the file again, or reproduce the request again.
A detective does not stop after naming a suspect. The scene has to be replayed. Otherwise you only have a feeling that the problem is gone.
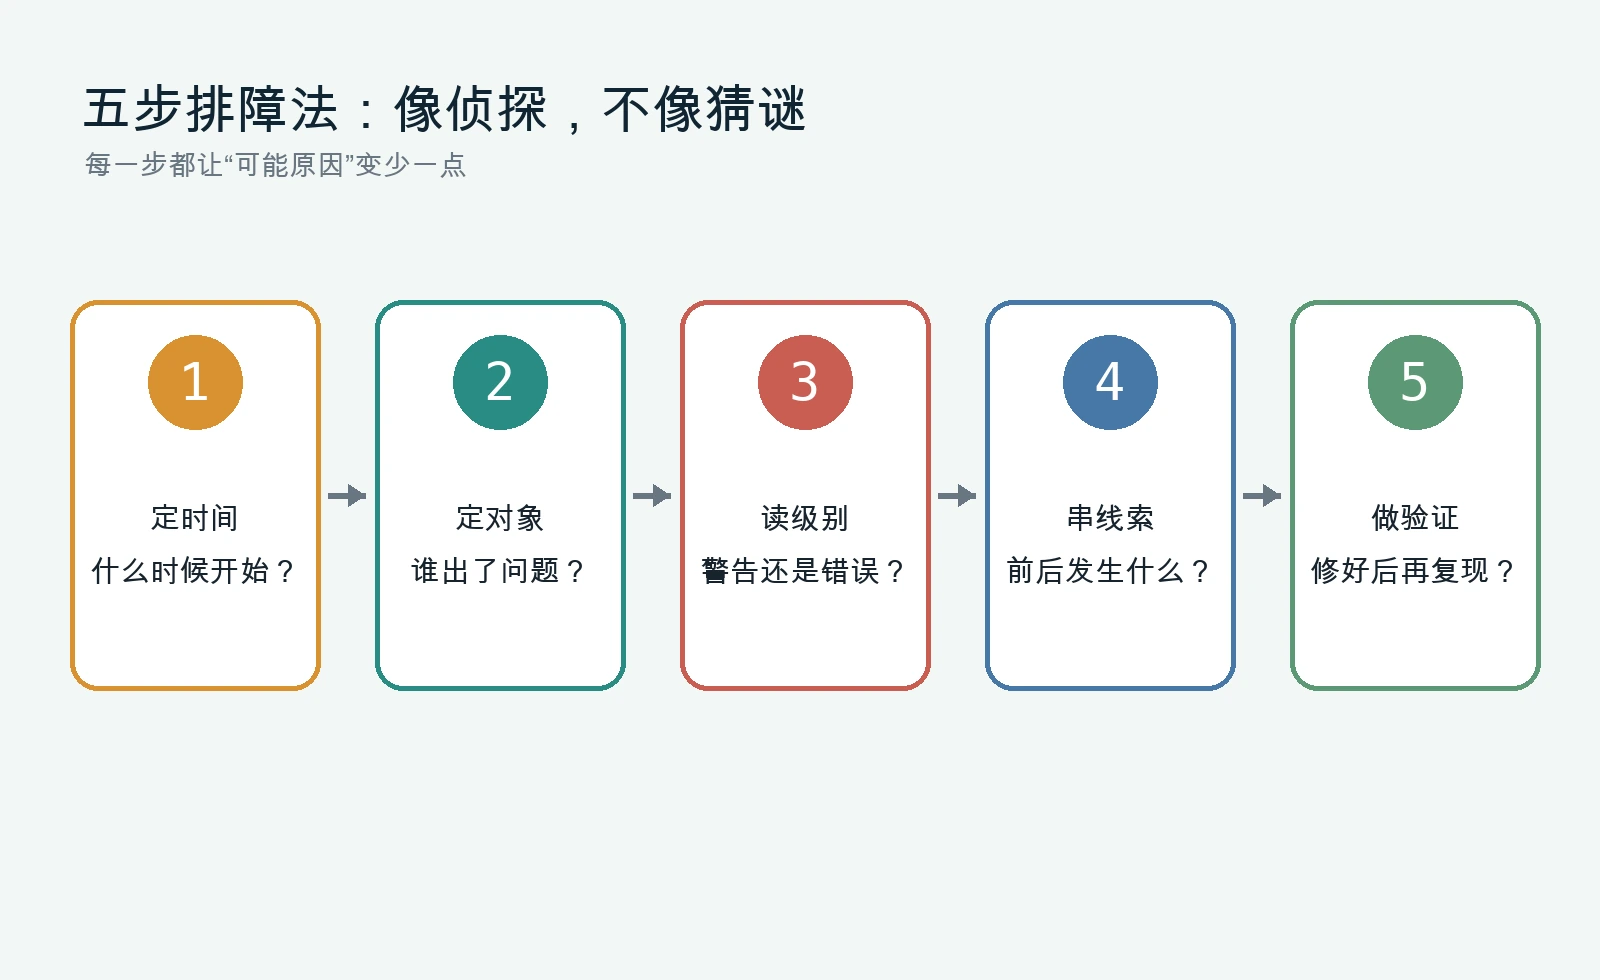
Figure 5: Break troubleshooting into five small questions and “I cannot fix computers” becomes “I know what to inspect next.”
Experiment one: why a nearly full disk creates unrelated errors
A disk is like a school bag. It does not become a problem only when the zipper is completely stuck. When there is almost no room left, finding and putting away things becomes difficult.
On macOS, start with:
df -h
On Ubuntu, include filesystem type and inode usage:
df -hT
df -ih
On Windows 11, use PowerShell:
Get-Volume | Select-Object DriveLetter, SizeRemaining, Size
These commands do not delete anything. They ask the warehouse manager how much space remains on each shelf. If the remaining space is low, investigate who uses it; do not delete a large directory merely because it looks large.
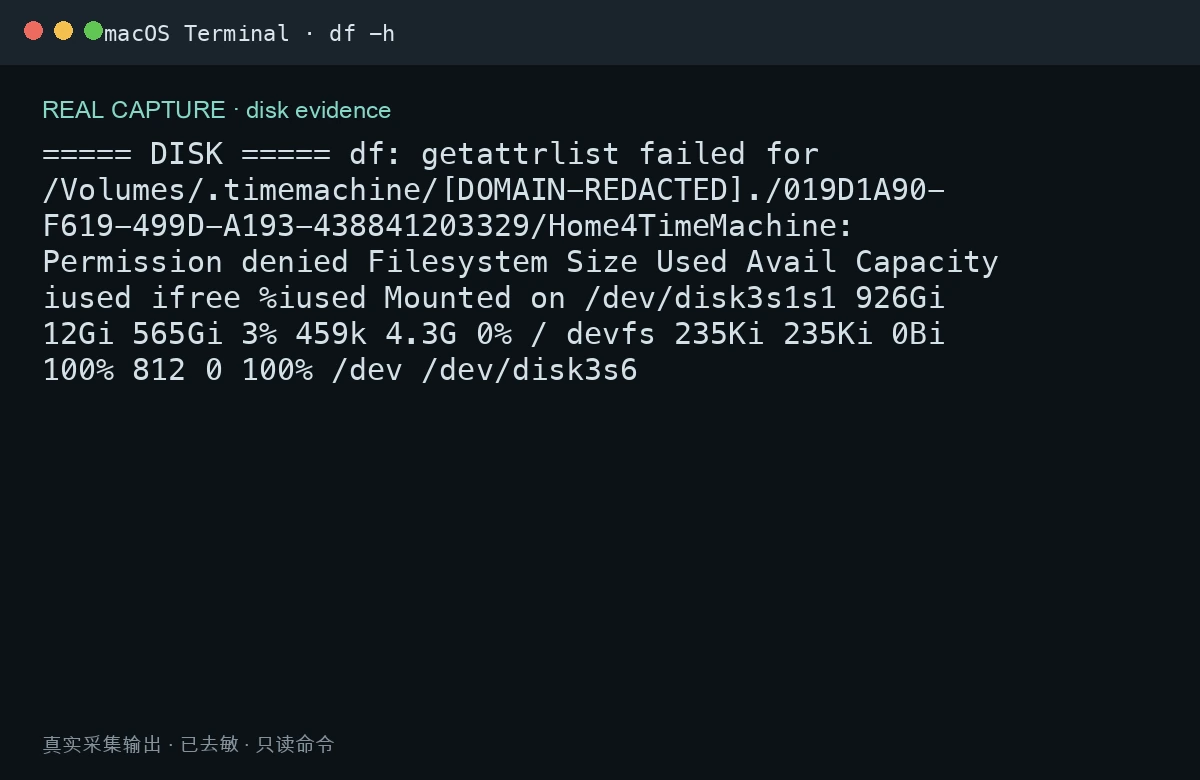
Figure 6: The real output is redacted. The screenshot demonstrates the evidence shape, not the private identity of a machine.
Experiment two: why a service failure appears to users as a page timeout
A service is like a restaurant kitchen. The web page is the front desk; databases, caches, and background workers are the kitchen. When the front desk says “there is no food,” the front desk may be fine. The kitchen may have lost power earlier.
On Ubuntu, inspect failed units and recent warnings:
systemctl --failed --no-pager
journalctl -b -p warning..alert --since "1 hour ago" --no-pager
On Windows, inspect recent system and application errors:
$since = (Get-Date).AddHours(-1)
Get-WinEvent -FilterHashtable @{LogName='System'; Level=1,2,3; StartTime=$since} -MaxEvents 100
macOS does not use the same systemd entry point, but its unified log can be filtered:
log show --last 1h --style compact \
  --predicate 'messageType == error OR messageType == fault'
The next capture comes from a real macOS 26 log show collection. It looks noisy, which is exactly why we narrow the time window and add process or severity filters: more log lines are not automatically more evidence.
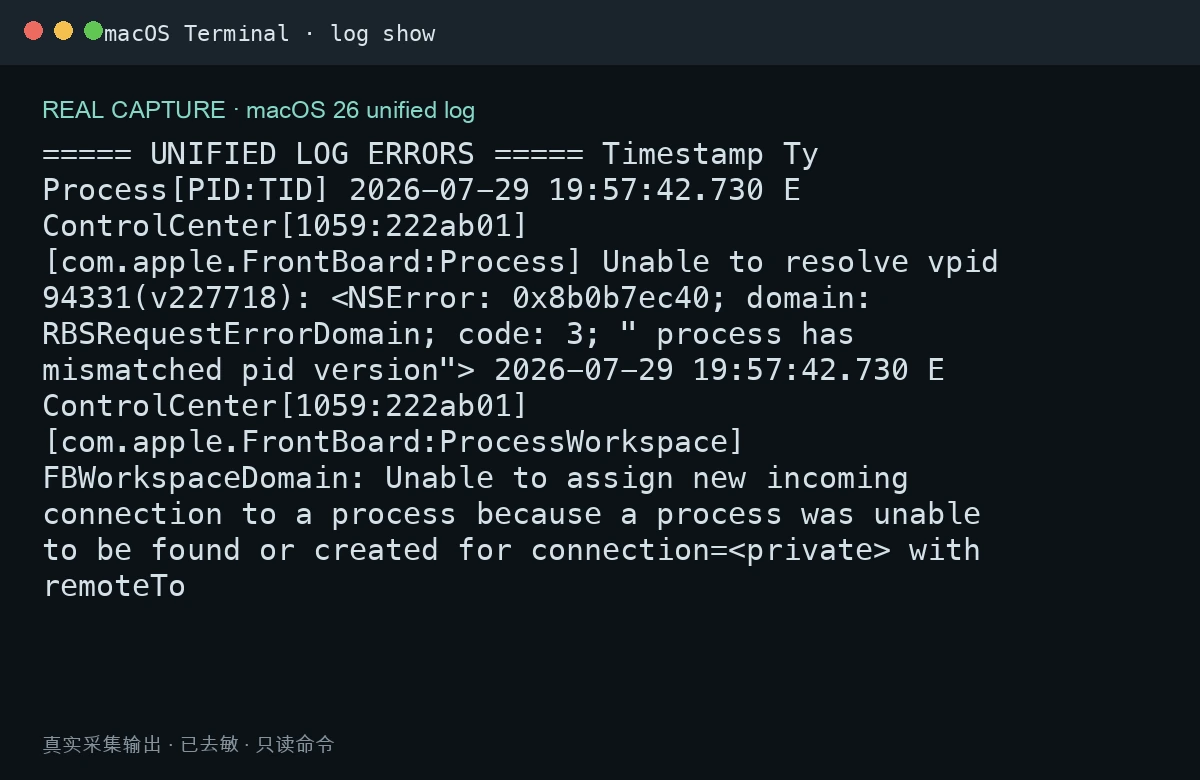
Figure 8: The real macOS output is redacted. It shows the native fields and the shape of the evidence.
The Ubuntu capture below comes from a real journalctl collection. It includes time, source, process, and message, much like a duty teacher writing “when, where, who, and what happened.”
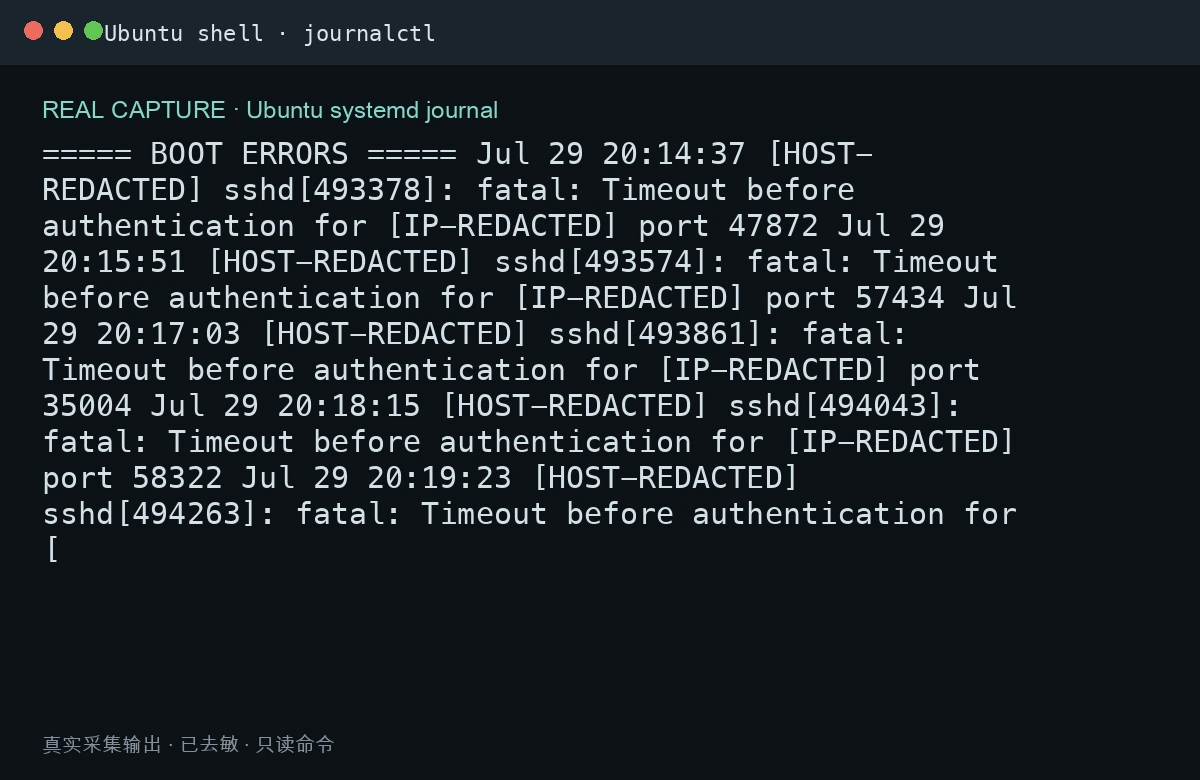
Figure 7: Identify the failing service before changing its configuration, port, or dependencies.
On macOS, I also queried a deliberately nonexistent service with the built-in launchctl command. This creates a safe example of a failed lookup without changing any service:
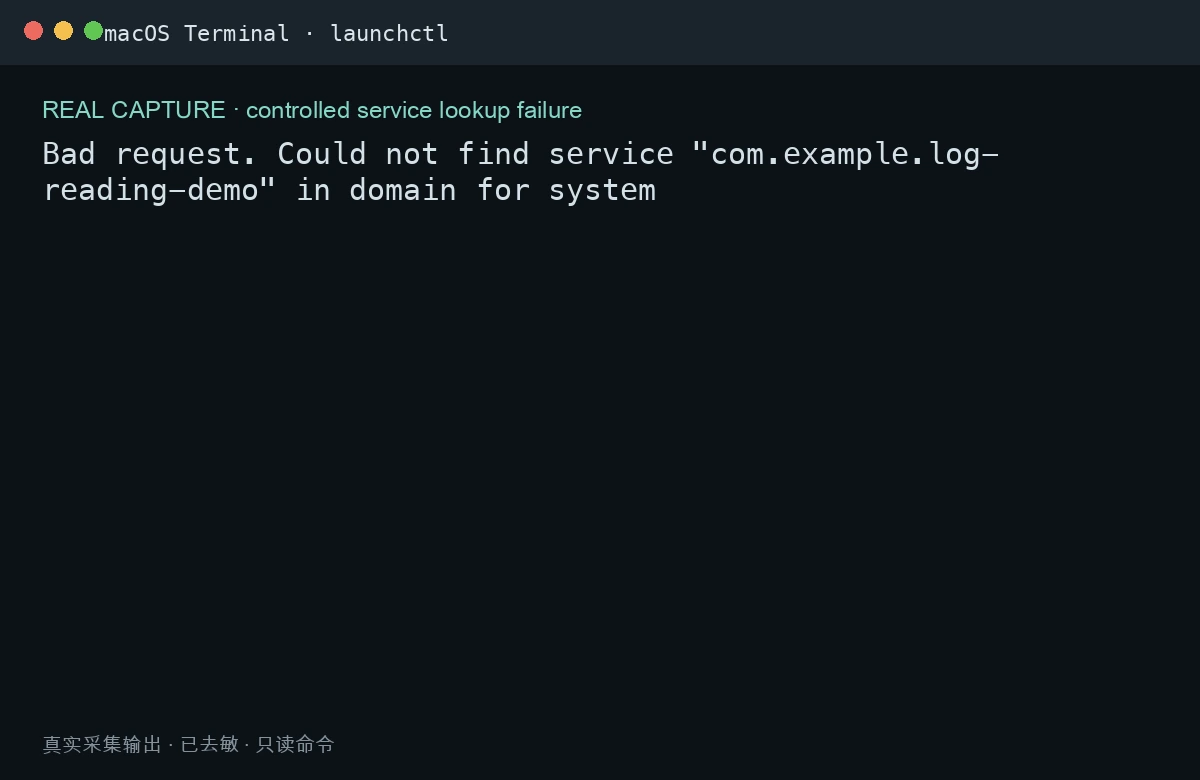
Figure 8: “The service does not exist,” “the service is not running,” and “the service starts then exits” are three different cases.
Experiment three: a network timeout may begin with DNS
“The page does not open” can mean at least four things: the name cannot be resolved, the interface has no address, no process listens on the port, or the application is too slow. To a user these look like one network problem. In logs they are four different notebooks.
Start with a small test:
getent ahosts example.com                 # Ubuntu
dscacheutil -q host -a name example.com   # macOS
Resolve-DnsName example.com               # Windows
If DNS works, inspect local listening ports:
ss -lntup                         # Ubuntu
netstat -anv -p tcp               # macOS
Get-NetTCPConnection -State Listen # Windows
I used a reserved example domain that does not exist to create a controlled lookup failure. It demonstrates the evidence shape without exposing real network information:
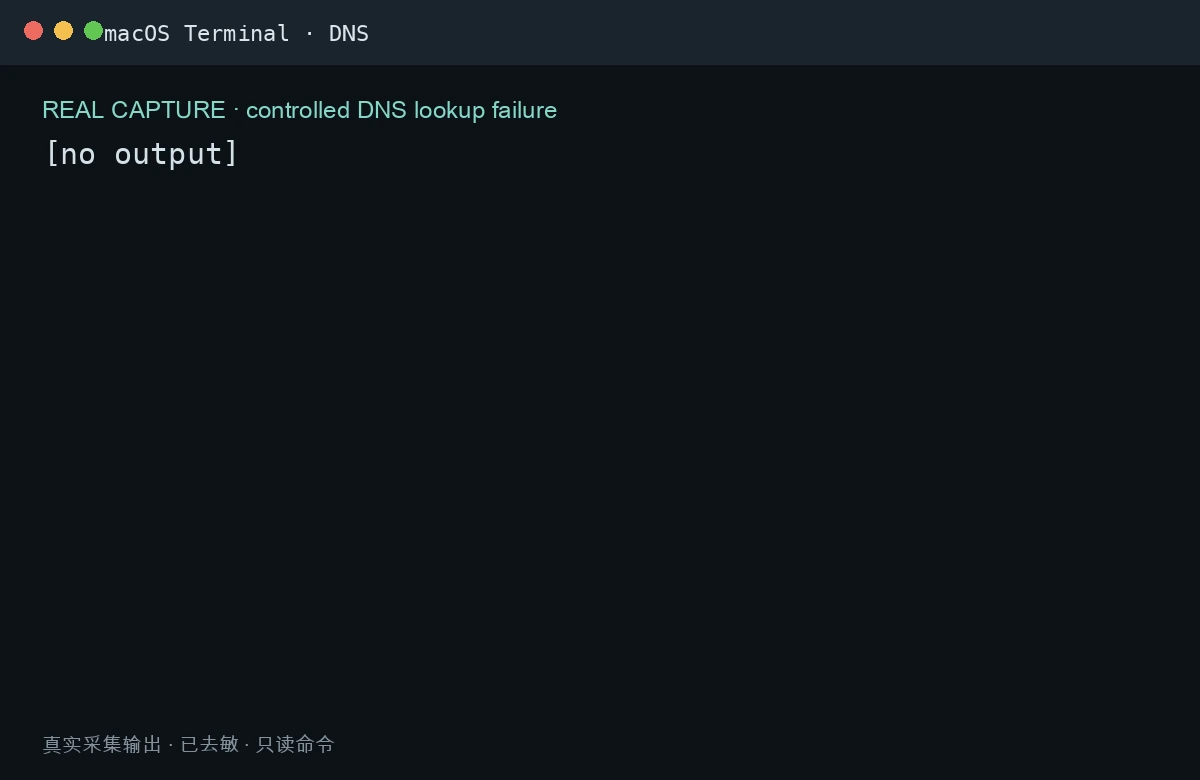
Figure 9: First decide whether the name can be found; only then discuss whether the service is running. Do not call every failure “the network.”
Windows 11, Ubuntu 26.04, and macOS 26 use different doors to the same room
The buttons and commands differ, but the reasoning is identical: find the system’s duty notebook, narrow the time window, filter by object, and verify.
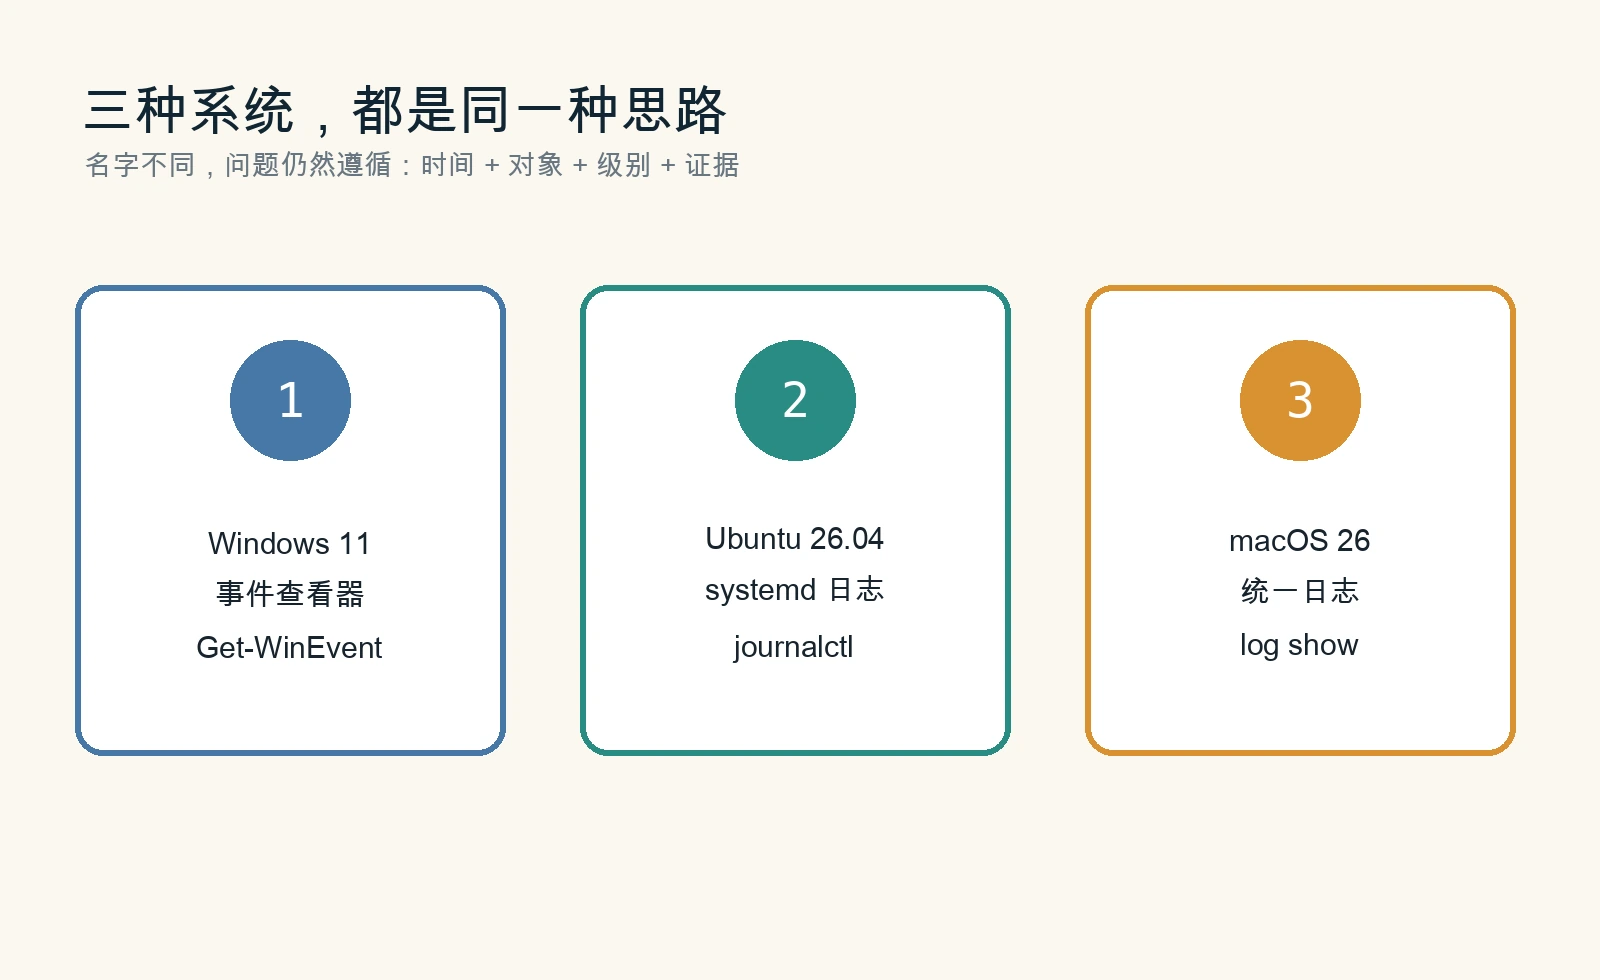
Figure 10: Windows emphasizes event logs, Ubuntu emphasizes the systemd journal, and macOS emphasizes unified logging. All answer the same questions.
Windows 11: Event Viewer and Get-WinEvent
The graphical entry point is Event Viewer. It is friendly for a first inspection: open “Windows Logs → System” or “Application,” then use “Filter Current Log” to limit time and level.
PowerShell is better for repeatable checks and Agents:
$since = (Get-Date).AddHours(-4)
Get-WinEvent -FilterHashtable @{
  LogName = 'System'
  Level = 1, 2, 3
  StartTime = $since
} -MaxEvents 200 |
  Select-Object TimeCreated, Id, LevelDisplayName, ProviderName, Message
The important part is not that the command is long. FilterHashtable asks Windows to filter before returning the records. It is like asking a librarian for “today’s Grade 3 math homework” rather than carrying the whole library to the desk.
Ubuntu 26.04: journalctl and systemctl
Many Ubuntu system services are managed by systemd. systemctl is the duty roster: which units run and which have failed. journalctl is the duty notebook: what they said and when.
systemctl status your-service.service --no-pager
journalctl -u your-service.service --since "30 minutes ago" --no-pager
journalctl -p err..alert -b --no-pager
If a service has no output, do not conclude that nothing happened. The time window may be wrong, permission may be missing, the unit name may be wrong, or the log may have rotated. Record what you checked and what the result was.
macOS 26: Console and log show
The Console app is useful for browsing and searching interactively. log show is better for repeatable collection:
log show --last 30m --style compact \
  --predicate 'process == "your-process"'
To focus on errors and faults:
log show --last 30m --style compact \
  --predicate 'messageType == error OR messageType == fault'
Unified logs can be very large, so time windows, process filters, and output limits matter. More logs do not automatically mean more evidence. Too many irrelevant lines can hide the clue.
One-command evidence collection: read-only, local, and redacted
The three collectors are available with the article:
They share four boundaries:
- only built-in operating-system tools;
- read-only by default: no service restart, file deletion, or firewall change;
- local report output only, with no third-party upload;
- redaction of IPv4 addresses, computer names, usernames, internal domains, and common secret formats before writing the report.
Manual automatic execution
Windows 11:
Set-ExecutionPolicy -Scope Process Bypass
.\collect-windows-11.ps1 -Hours 4 -OutputDirectory "$HOME\Desktop\log-report"
Get-Content "$HOME\Desktop\log-report\windows-log-report.txt" -TotalCount 80
Ubuntu 26.04:
chmod +x collect-ubuntu-26.04.sh
./collect-ubuntu-26.04.sh --hours 4 --output "$HOME/log-report"
sed -n '1,120p' "$HOME/log-report/ubuntu-log-report.txt"
macOS 26:
chmod +x collect-macos-26.sh
./collect-macos-26.sh --hours 4 --output "$HOME/log-report"
sed -n '1,120p' "$HOME/log-report/macos-log-report.txt"
Open the report before deciding how to investigate further. The collector prepares the scene; it does not pretend to know the root cause.
Agent automatic configuration
If you want Codex, Claude, OpenClaw, HermesAgent, or another Agent to help, give it a complete safety contract like this:
Goal: collect read-only troubleshooting evidence from the last four hours.

Hard boundaries:
1. Use only built-in operating-system commands. Do not install tools or upload logs.
2. Do not delete files, restart services, change the firewall, change DNS, or change users and permissions.
3. Run the collector before forming a root-cause theory. Read the report after collection.
4. Redact full IPs, computer names, usernames, internal domains, keys, and tokens before displaying output.
5. Classify every conclusion as “directly proven by logs,” “reasonable hypothesis,” or “needs verification.”
6. Before any repair, show evidence, risk, and rollback steps, then wait for human confirmation.
7. Finish with a timeline, most likely cause, alternative hypotheses, verification commands, and unresolved questions.
The dangerous behavior is not that an Agent cannot write a command. It is that it may become confident without evidence. Read-only collection, redaction, confirmation, and verification are the safety helmet.
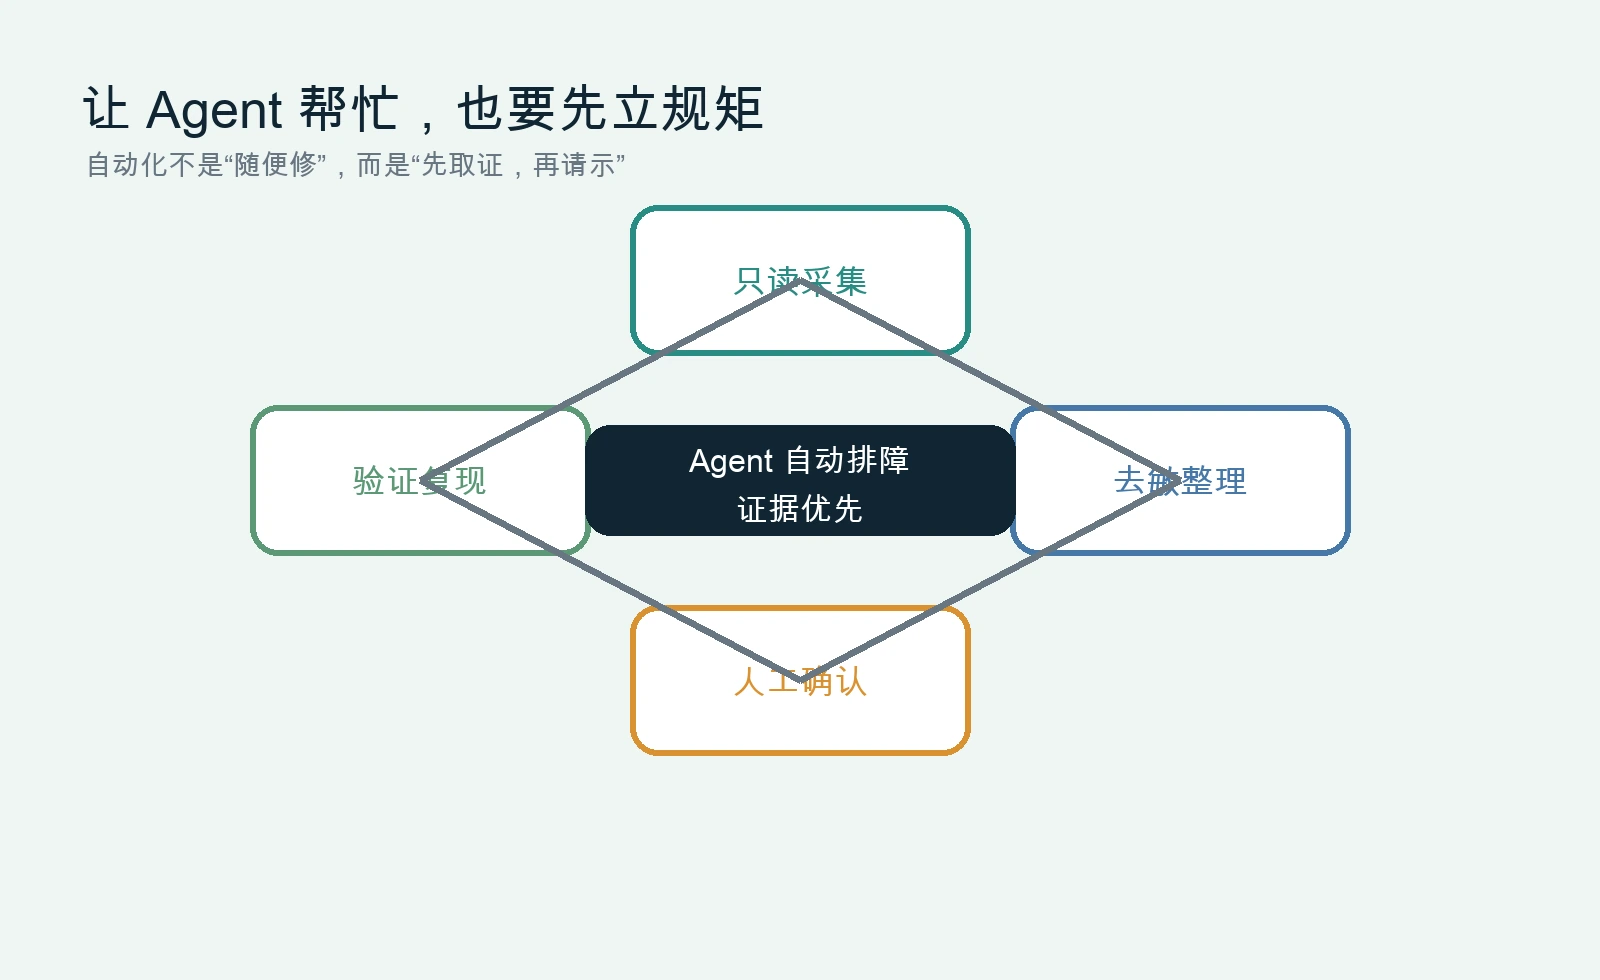
Figure 11: An Agent can make evidence collection faster, but people should confirm high-risk actions.
Common mistakes when reading logs
Looking only at the last red error
The last event is often the victim. It tells you where the system fell, not necessarily who pushed it. Expand the time window backward and find the earliest unusual event.
Treating every ERROR as the root cause
Background probes, retries, and compatibility warnings are common. An ERROR without context is a clue, not a conclusion.
Treating “no log” as “nothing happened”
You may have searched the wrong source, lacked permission, used too narrow a time window, hit log rotation, or the program may have failed before it could start logging.
Clearing logs as soon as they look messy
Clearing logs is like deleting surveillance footage. It can make the room look tidy, but it also removes the evidence. Unless a documented retention or compliance policy requires it, do not erase the scene just to make it feel cleaner.
Posting raw logs in a public chat
Logs may contain addresses, usernames, cookies, tokens, paths, and business data. Redact before sharing. If another person only needs to help with a diagnosis, a timeline and a few relevant lines are usually enough.
Q&A for children and beginners
I cannot understand the logs. Does that mean I am not suited for troubleshooting?
No. Do not try to understand every word at once. Start with time, source, severity, and repeated keywords. Reading logs is like reading a detective story: you do not need to know every character immediately. First learn who did what and when.
Can one log line give me the answer directly?
Sometimes, but usually not. A log is evidence, not an answer sheet. It may prove that an action failed while the root cause is an earlier permission, configuration, disk, or dependency problem.
I only use graphical interfaces. Can I still learn this?
Absolutely. Windows Event Viewer, macOS Console, and Linux service tools are all valid learning paths. Command-line tools are easier to copy, repeat, filter, and give to an Agent; that does not make graphical tools less professional.
Why redact logs if I am only looking at them locally?
Because troubleshooting often means sharing a screenshot with someone else or sending evidence to an Agent. A file that is local today may enter a ticket, chat room, backup, or public article tomorrow. Redacting first is much easier than reconstructing a leak later.
Can an Agent fix the problem for me?
Low-risk, reversible actions may be automated. Data deletion, network changes, permission changes, and restarts of important services should require confirmation. The best Agent is not the one that always acts; it is the one that knows when to stop and ask.
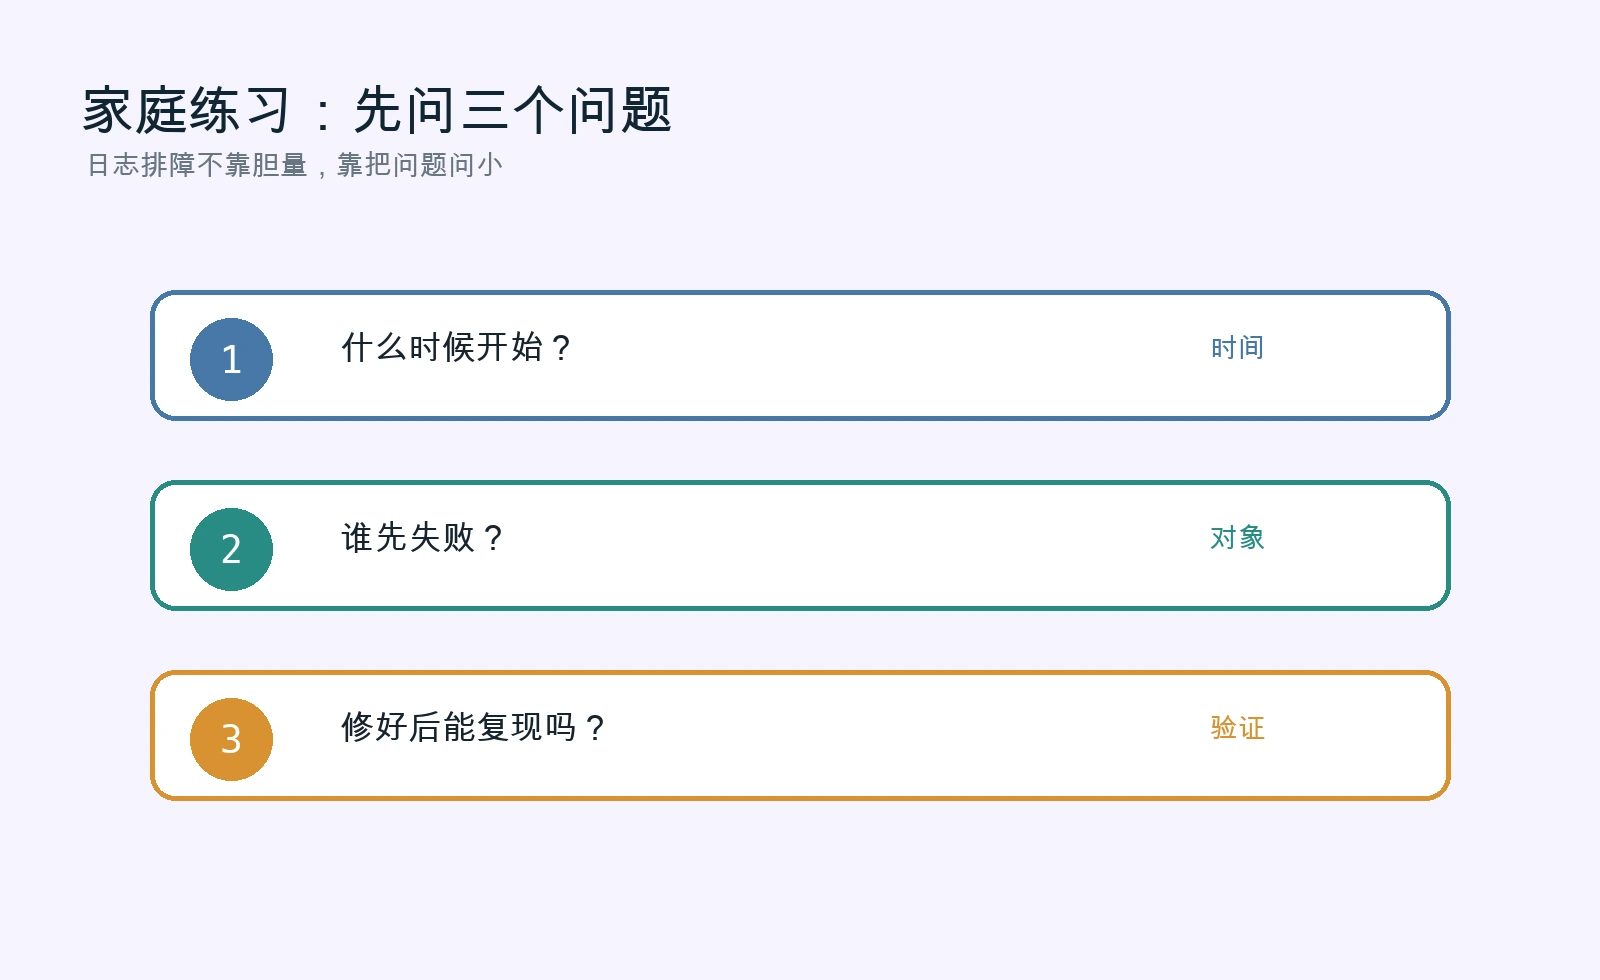
Figure 12: If a child can answer these three questions, they already understand the skeleton of troubleshooting.
Final thought: the computer is writing a diary already
The most important log skill is not memorizing a hundred commands. It is learning the order of operations: observe before guessing, collect evidence before changing things, and verify after repairing.
Windows 11 Event Viewer, Ubuntu 26.04 journalctl, and macOS 26 log show are different notebooks. The transferable method is the same: narrow the time range, identify the object, understand the severity, build the timeline, and reproduce the result.
If you remember only one sentence, make it this:
The computer probably did not fail out of nowhere. It wrote the diary first; we simply had not turned to that page yet.