128MB of RAM in Production? The 10 Switches Every New PostgreSQL Home Needs
TL;DR
In the previous post we migrated data from MySQL into PostgreSQL with pgloader. This one delivers on the promise made back then: the “renovation” after moving in — production tuning. I ran a factory physical exam on a fresh PostgreSQL 18 install, and the results are startling: shared_buffers defaults to 128MB, work_mem to 4MB, and 150 concurrent connections get flat-out rejected. The defaults are not “recommended values” — they are a compatibility floor that guarantees PostgreSQL starts on any ancient machine. Using a real 2-core / 2GB Docker sandbox, this article benchmarks 10 switches across four fronts — memory, connections, writes, and cleanup: a live demo of a sort spilling to disk and losing half its speed, the FATAL error when connections hit the wall, and a tuned instance serving 852 TPS at 150 concurrency. Everything is reproducible, with one-click sandbox scripts for Windows 11 / Ubuntu 26.04 / macOS 26.
Figure 1: Cover (self-made). Moving in is just the beginning; renovation decides how comfortable the home is.
1. Background: The Move Succeeded, but the New Home Feels Cramped
A reader left a comment on the last post that speaks for many:
“The pgloader move went smoothly and all data checked out. But after cutting over to PG, on the same hardware, evening-peak report queries are nearly twice as slow as MySQL, and when connections climb it throws errors outright. Wasn’t PG supposed to be better?”
This is not an isolated case. Nearly every team that migrates from MySQL to PostgreSQL goes through a “performance disillusionment” in the first month after go-live. It’s not that PG is slow — it’s that you are running production on factory default settings.
An analogy: you bought a powerful off-road vehicle, but the dealership delivered it in “learner mode” — speed capped at 40, AC on minimum, suspension on softest. Nothing wrong with the car; the settings were never unlocked. PostgreSQL’s default configuration is exactly that learner mode.
2. Symptoms: The Factory Physical Exam
I started a fresh PostgreSQL 18.6 container in a sandbox (capped at 2GB RAM to simulate a small production box) and pulled the 12 performance-critical parameters first thing:
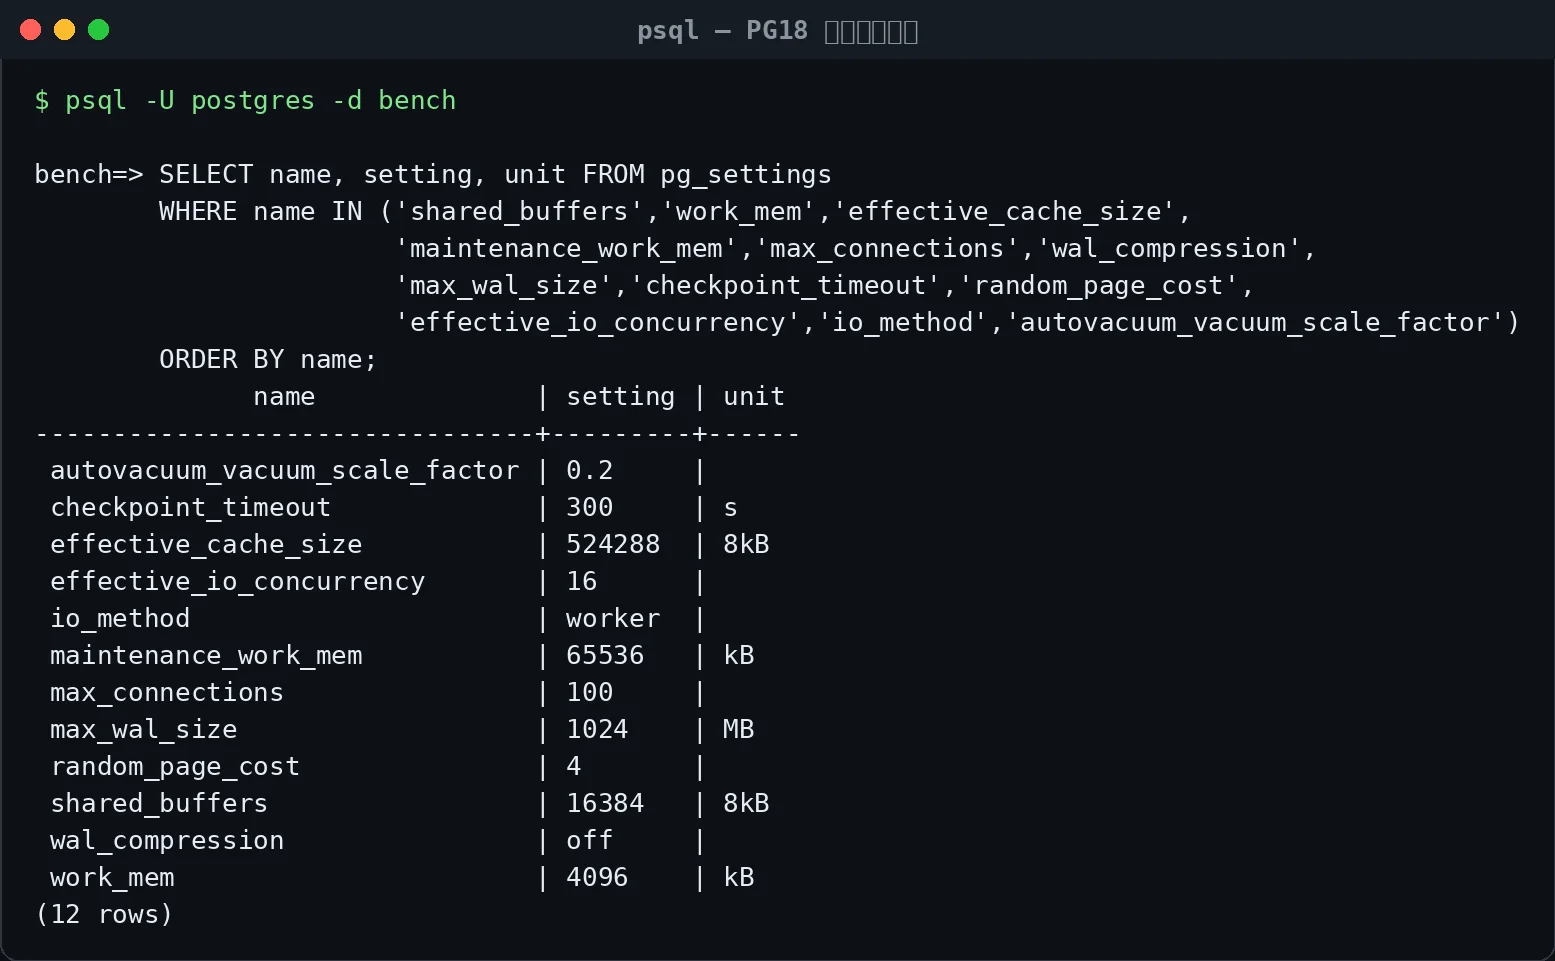
Figure 2: Real capture. Reading the report card: shared_buffers 16384×8kB = 128MB (in 2026, your phone has 100x that); work_mem = 4MB (any serious sort spills to temp files); max_connections = 100 (one mid-size app’s connection pool can exhaust it); random_page_cost = 4 (still living in the spinning-disk era).
Then I loaded 5 million rows with pgbench (scale 50, ~750MB) and ran a 16-client baseline:
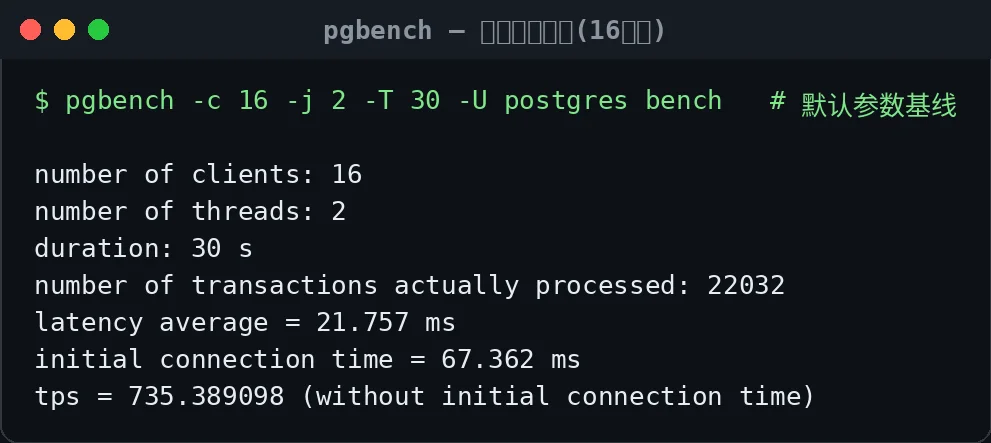
Figure 3: Real capture. 16 clients, 30 seconds: 735 TPS, 21.8ms average latency. Looks acceptable? Hold that thought.
Then I raised concurrency to 150 — a perfectly normal peak for a mid-size application:

Figure 4: Real capture. FATAL: sorry, too many clients already — every connection past 100 is turned away, and the benchmark never even starts. This is not a performance problem; it’s an availability problem: your database hangs a “FULL” sign on the door during rush hour.
Exam conclusion: a default-configured PostgreSQL is not merely slow — it may refuse patients at peak hour.
3. Analysis: Why Is PostgreSQL So Stingy by Default?
To understand this stingy report card, look at its origins. PostgreSQL’s defaults must satisfy one harsh goal: successful startup on any machine that can run at all — including 512MB VMs, shared hosts, even a developer’s old laptop. If defaults were aggressive, initdb would fail at the very first step and new users would churn immediately.
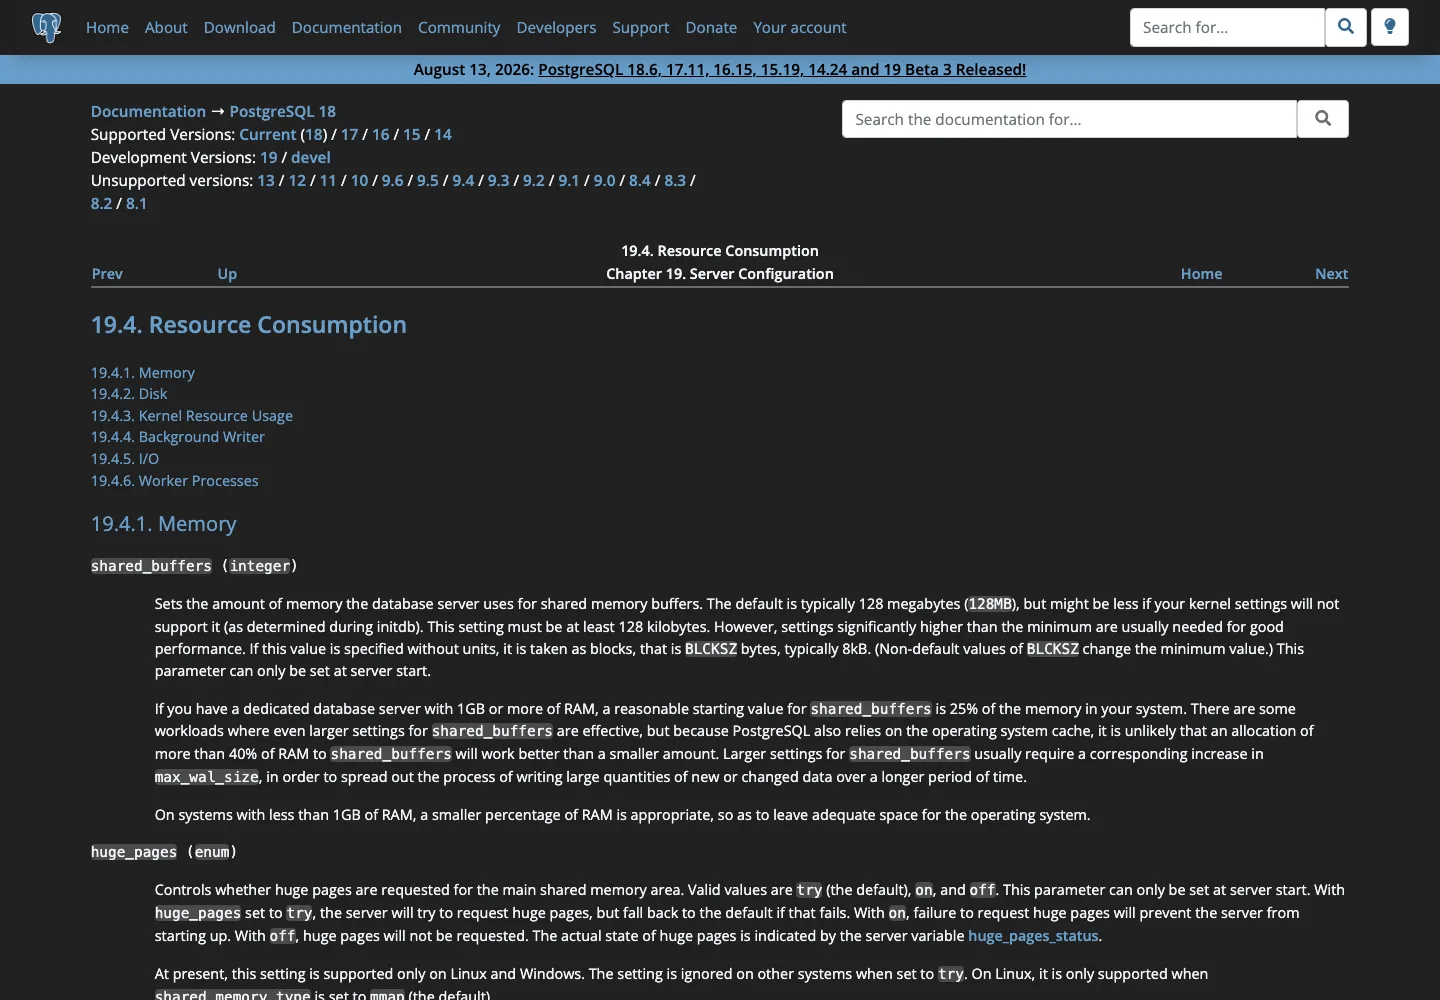
Figure 5: Real capture (postgresql.org). The official docs say it plainly: shared_buffers defaults to 128MB, immediately followed by “a reasonable starting value is 25% of the memory in your system” — the default is the pass line; 25% is the official starting line.
It’s like the “temporary utilities” in a newly delivered house: the developer only guarantees you can light a bulb and boil a kettle. Whether three air conditioners trip the breaker is a renovation-stage question. Installation complete ≠ renovation complete.
4. Root Cause: Defaults Are a “Floor,” Not a “Recommendation”
This is the single most important sentence in this article: PostgreSQL’s defaults are a compatibility floor, not a performance recommendation.
MySQL veterans are easily misled here, because InnoDB’s defaults have grown increasingly “adaptive” under Oracle (innodb_buffer_pool_size auto-sizes in newer versions), creating the illusion that databases ship pre-tuned. PostgreSQL’s community philosophy is the opposite: parameters are your responsibility. The toolchain is all there — docs, PGTune, countless tuning guides — but the hand on the knob must be yours.
And tuning, broken down, is a resource-budgeting problem on four fronts. Think of the database as a restaurant:
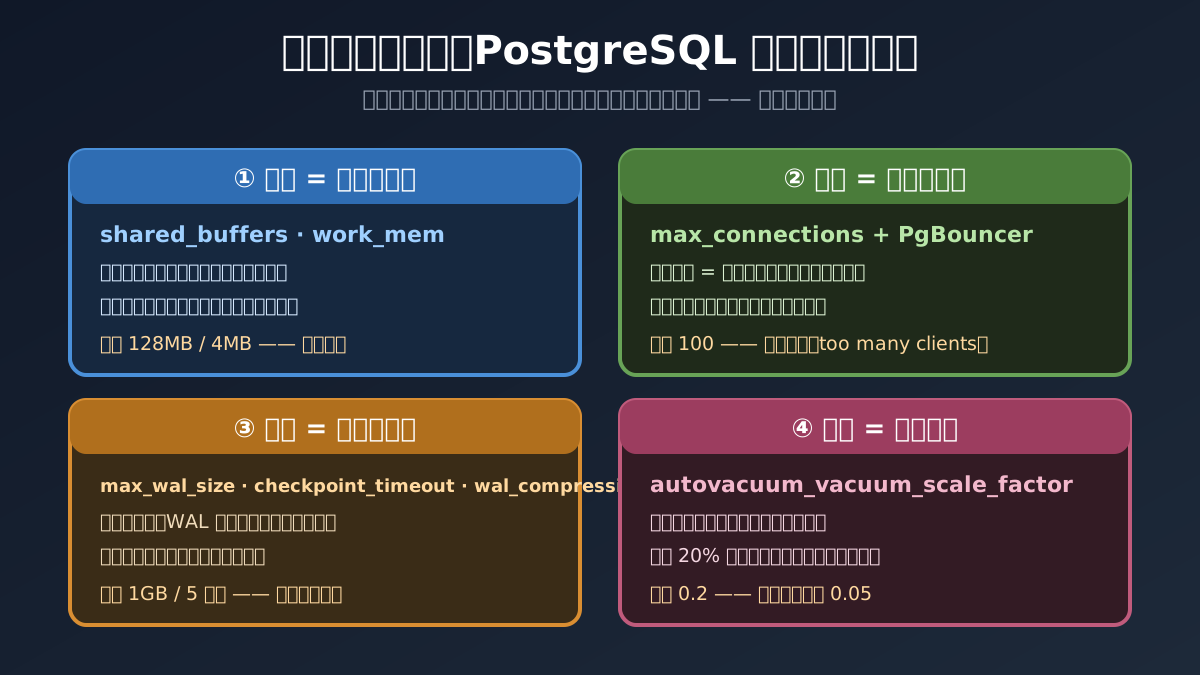
Figure 6: Self-made diagram. Memory is the prep station, connections are the waitstaff, writes are receipts and inventory counts, cleanup is the janitor. Sections 5 through 8 fight each front in turn.
5. Memory: Four Area Questions in a Hotpot Restaurant
Memory is the main battlefield — 4 of the 10 switches live here. In hotpot-restaurant terms:
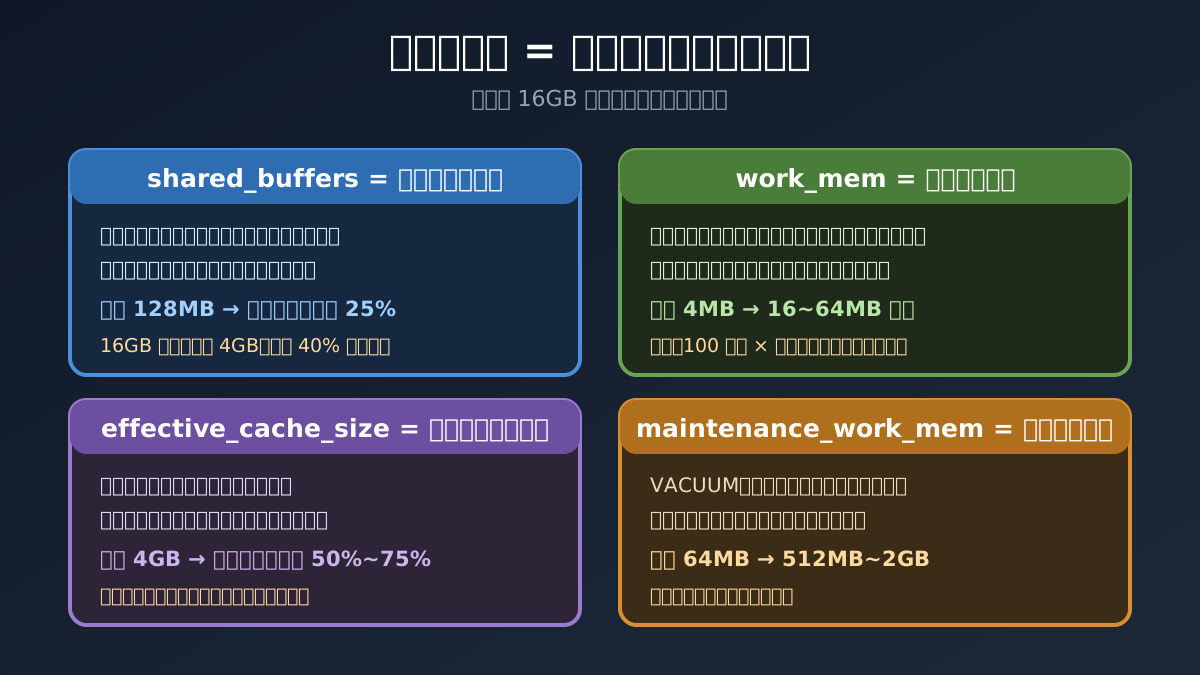
Figure 7: Self-made diagram. Recommended values assume a 16GB dedicated database server. One core principle: give the public area (shared_buffers) generously, budget each table’s condiment tray (work_mem) carefully.
Switch 1: shared_buffers (the shared warming station). The hot-data cache shared by the whole restaurant. Default 128MB; the official docs suggest 25% of physical RAM, with diminishing returns past 40%. On a 16GB box, start with 4GB.
Switch 2: work_mem (each table’s condiment tray). Scratch space for sorts and hashes. Mind how it’s billed: one allocation per connection, per sort/hash step. With 100 connections running sort-heavy reports, real usage can be 100 × 2 steps × work_mem. So bigger is not better — budget it as “memory budget ÷ concurrent connections ÷ 2”, typically 16~64MB to start. The cost of a too-small tray, measured live — a 5-million-row sort at 4MB vs 256MB:
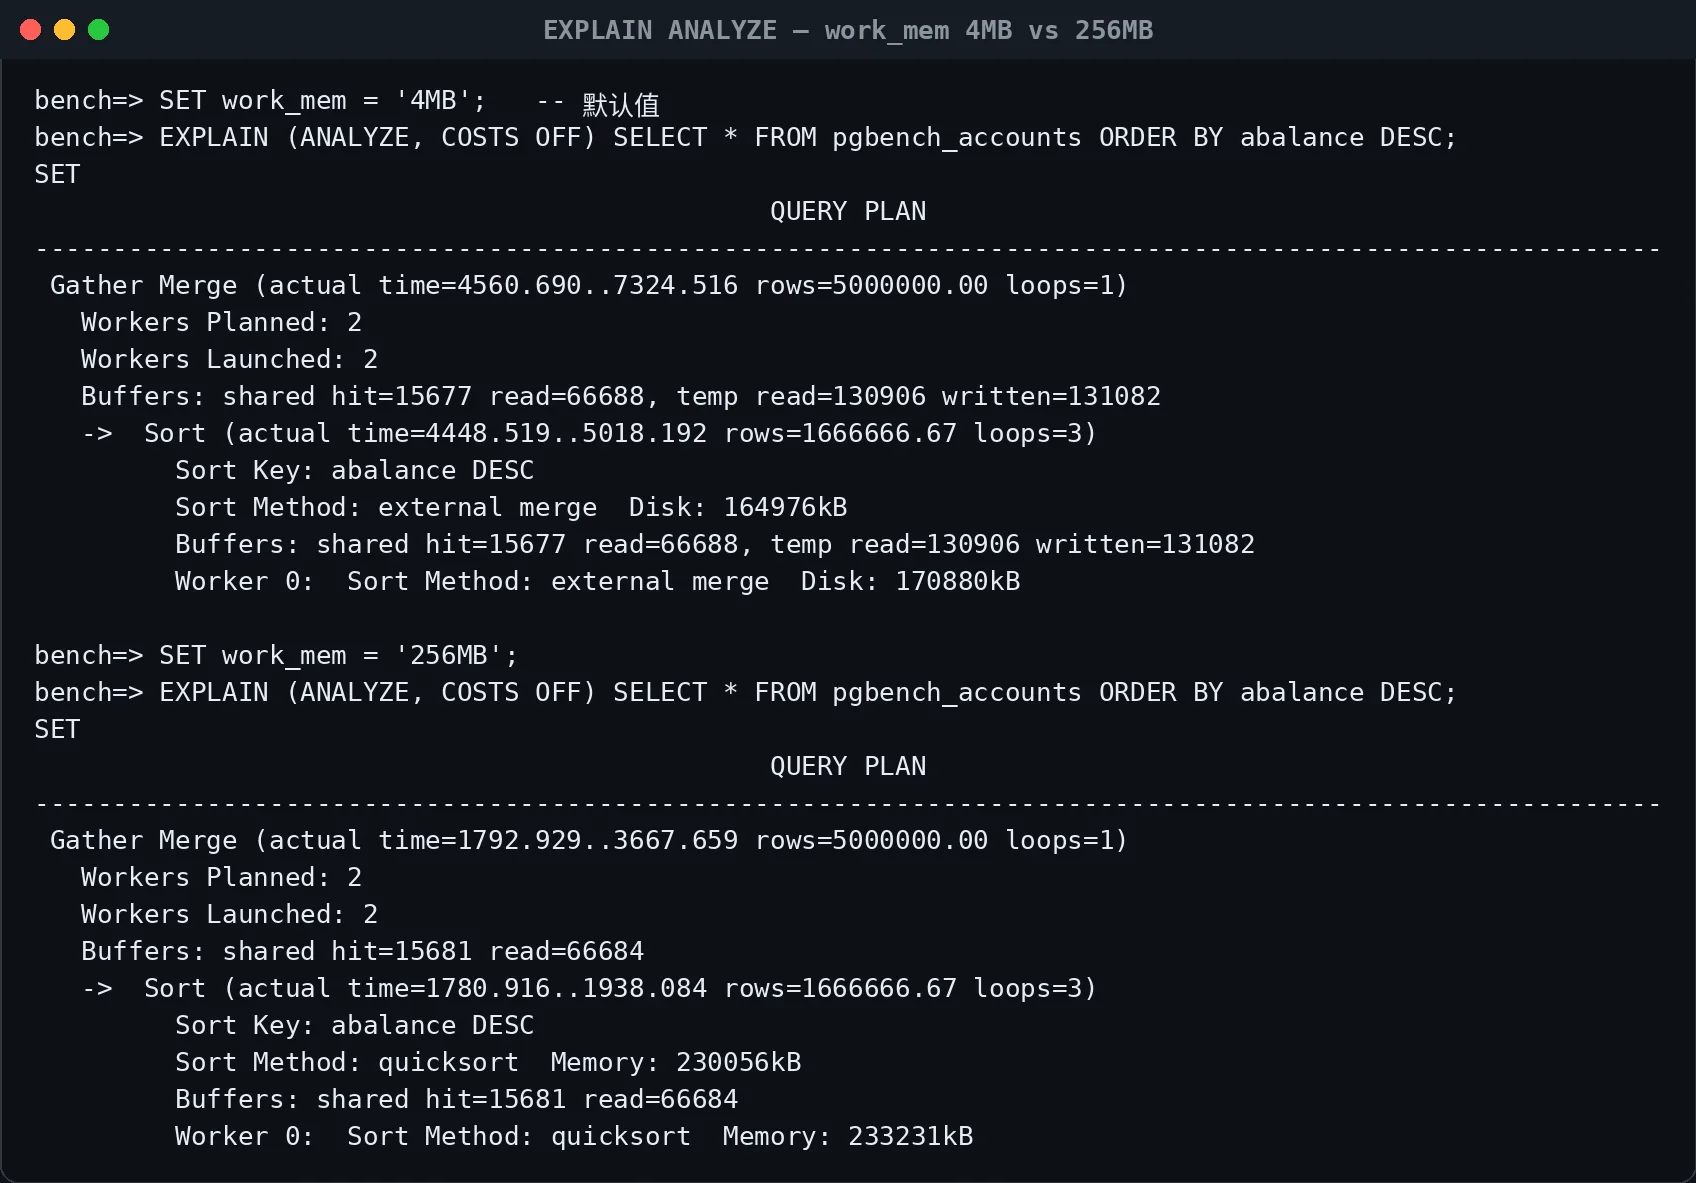
Figure 8: Real capture. Same SQL: at work_mem = 4MB the Sort Method is external merge Disk: 164976kB (161MB spilled to disk, 7.3 seconds); at 256MB it becomes quicksort Memory: 230056kB (pure in-memory, 3.7 seconds). A 2x difference from one parameter. Seeing external merge Disk in your slow-query plan is the tell that the tray is too small.
Switch 3: effective_cache_size (telling the headwaiter how big the warehouse is). It occupies zero memory; it’s a “statement” to the planner about how much cache exists in total (PostgreSQL’s plus the OS page cache). Understate it and the planner assumes the warehouse is tiny, shies away from indexes, and prefers full table scans. Set it to 50%~75% of physical RAM.
Switch 4: maintenance_work_mem (the after-hours deep-clean area). Used by VACUUM, CREATE INDEX, ALTER TABLE; it doesn’t affect everyday queries, so feel free to give 512MB~2GB. It’s the single most visible speedup for building indexes on big tables.
6. Connections: More Waiters Isn’t Better
The second wall is connection count. PostgreSQL’s connection model is “one connection, one process” — every guest gets a dedicated waiter. Waiters are loyal, but each takes headcount (5~10MB of memory) and a seat on the schedule (CPU context switches).
What happens when 1,000 guests flood in? The boss’s instinct is “hire more waiters” (raise max_connections), which is precisely the classic rookie trap: 1,000 processes fighting over CPUs spend most of their time context-switching, and throughput drops instead of rising. The right answer is hiring a headwaiter — PgBouncer:
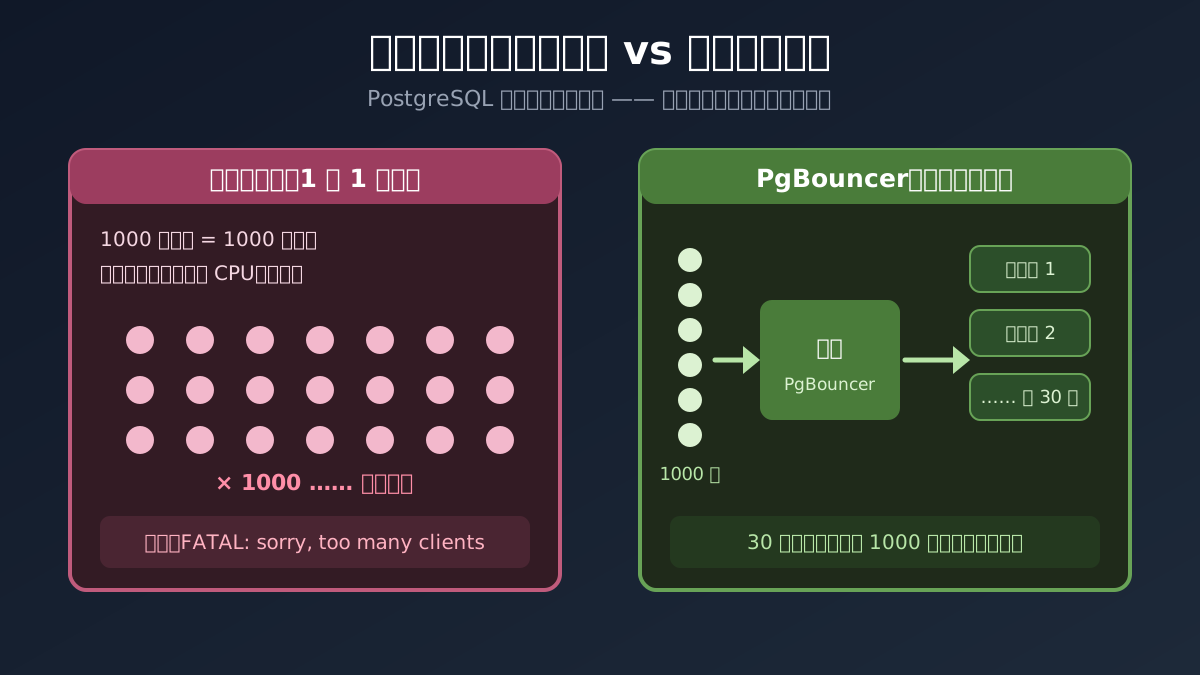
Figure 9: Self-made diagram. Left: one waiter per guest, 1,000 guests wreck the restaurant. Right: a headwaiter hands out queue tickets; 30 waiters serve 1,000 guests in rotation.
I reproduced the wall live. Simulating a connection storm against the default max_connections = 100:
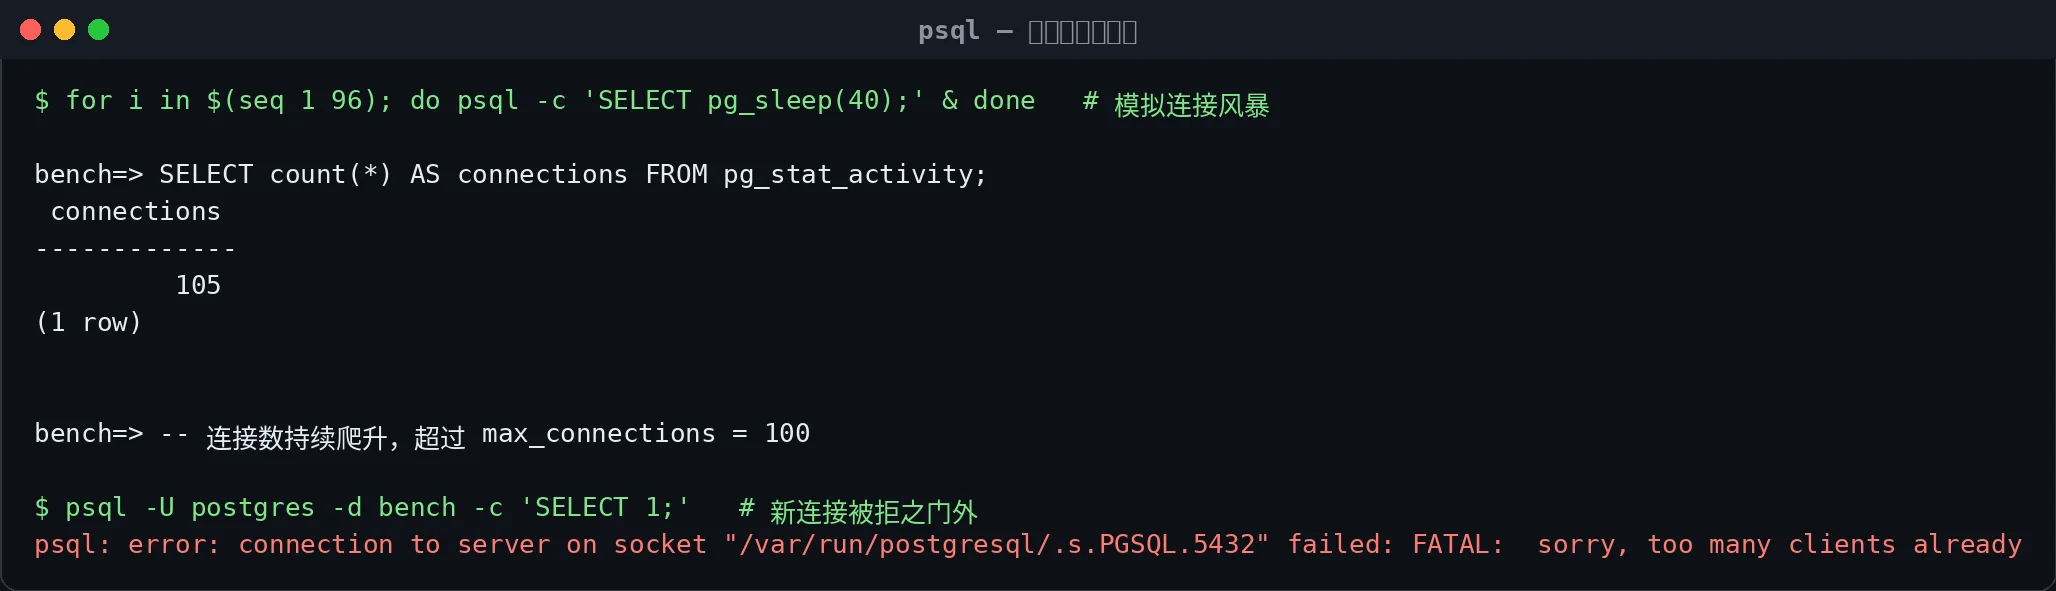
Figure 10: Real capture. Once pg_stat_activity shows 105 active entries, every new connection — including the DBA’s own psql — gets FATAL: sorry, too many clients already. The scariest part isn’t that the business can’t connect; it’s that the firefighter can’t get through the door.
Switch 5: max_connections + PgBouncer combo. The correct posture is “one up, one down”: raise max_connections moderately to 200~300 (headroom for the pool and for operations), and put PgBouncer in front in transaction mode, folding thousands of external connections into a few dozen real ones. The app talks to PgBouncer; PgBouncer talks to PG — guests see queue tickets, never the kitchen.
7. Writes: Receipts and Inventory Counts
PG’s write path writes the WAL (write-ahead log) before data pages — exactly like a cashier’s workflow:
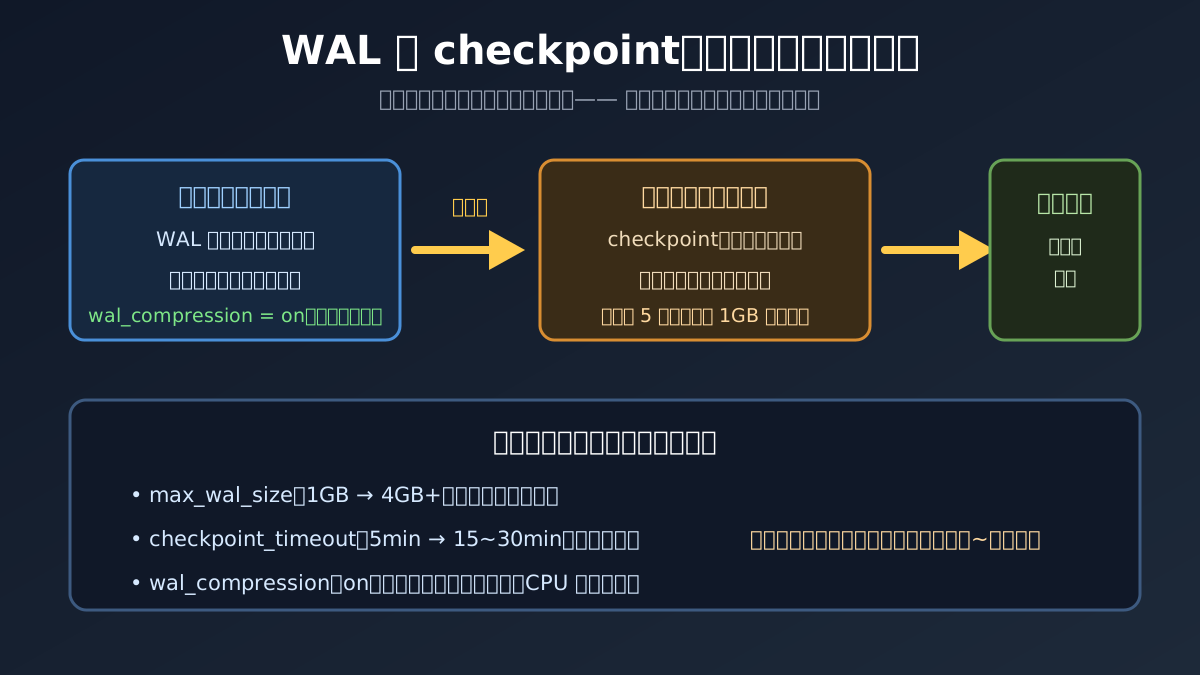
Figure 11: Self-made diagram. Every sale gets a receipt first (WAL sequential write — fast); periodically the receipts are copied into the ledger (checkpoint — concentrated random writes, slow). Count inventory too often and peak hours stutter.
Under defaults, a checkpoint fires every 5 minutes or whenever receipts pile up to 1GB (max_wal_size). With heavy writes, counts become dense and each is an I/O spike — on monitoring, a sawtooth latency pattern.
Switch 6: wal_compression = on. Compress the receipts; write volume drops immediately, CPU cost is barely noticeable. On PG18 it shows as pglz once active.
Switch 7: max_wal_size, 1GB → 4GB+. Save up more receipts before counting, thinning out the spikes. The cost: crash recovery reads a few more pages of receipts (a few to tens of seconds longer) — a worthwhile trade for most systems.
Switch 8: checkpoint_timeout, 5min → 15~30min. Stretch the timed counts too; the two switches work together.
8. Cleanup: Old Clothes in the Wardrobe
The fourth front is the one MySQL veterans most easily miss, because InnoDB has no equivalent. PG’s MVCC means DELETE and UPDATE don’t free space immediately — old row versions (dead tuples) stay in place until the autovacuum janitor shows up:
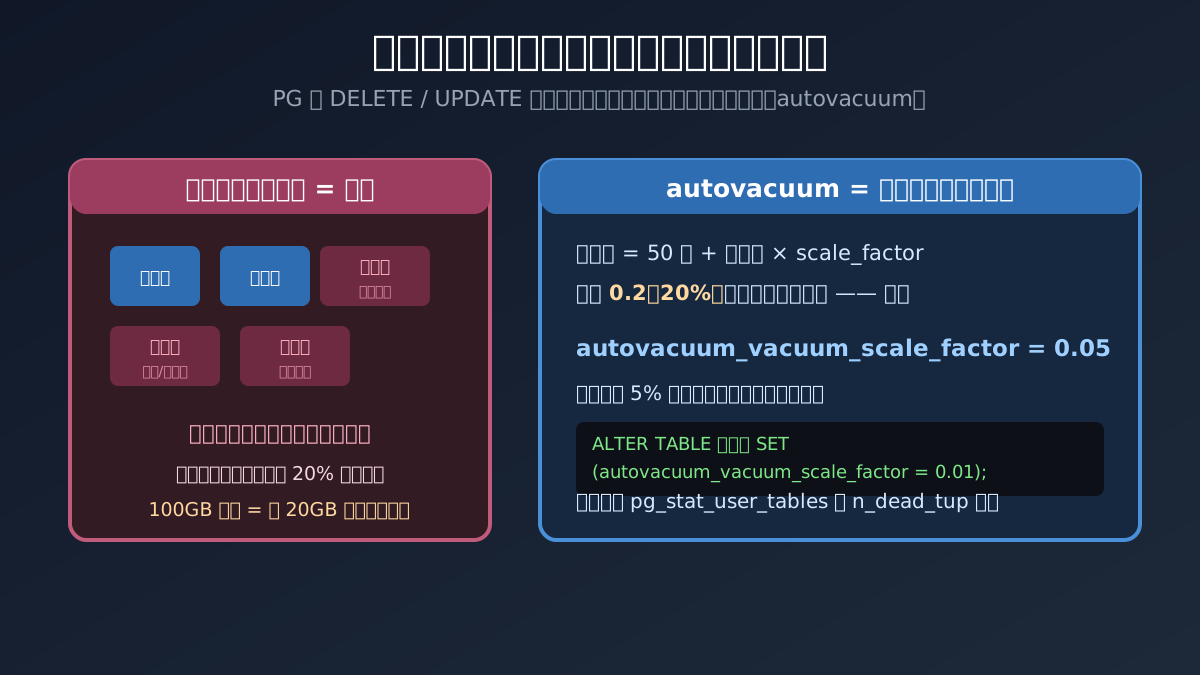
Figure 12: Self-made diagram. The default trigger line is “dead tuples exceed 20%” — diligent on small tables, lazy on big ones, exactly backwards: a 100GB table accumulates 20GB of garbage before a single cleanup.
Switch 9: autovacuum_vacuum_scale_factor, 0.2 → 0.05. Lower the janitor’s trigger line for big tables; for individual giant tables, ALTER TABLE ... SET (...) can push it to 0.01. Keep an eye on n_dead_tup in pg_stat_user_tables to know whether the janitor is keeping up.
9. Perception: Telling PG You Have an SSD
The last switch fixes an “era bias.” PG’s query planner decides by cost model, and the disk price list in that model still dates from the spinning-disk era:
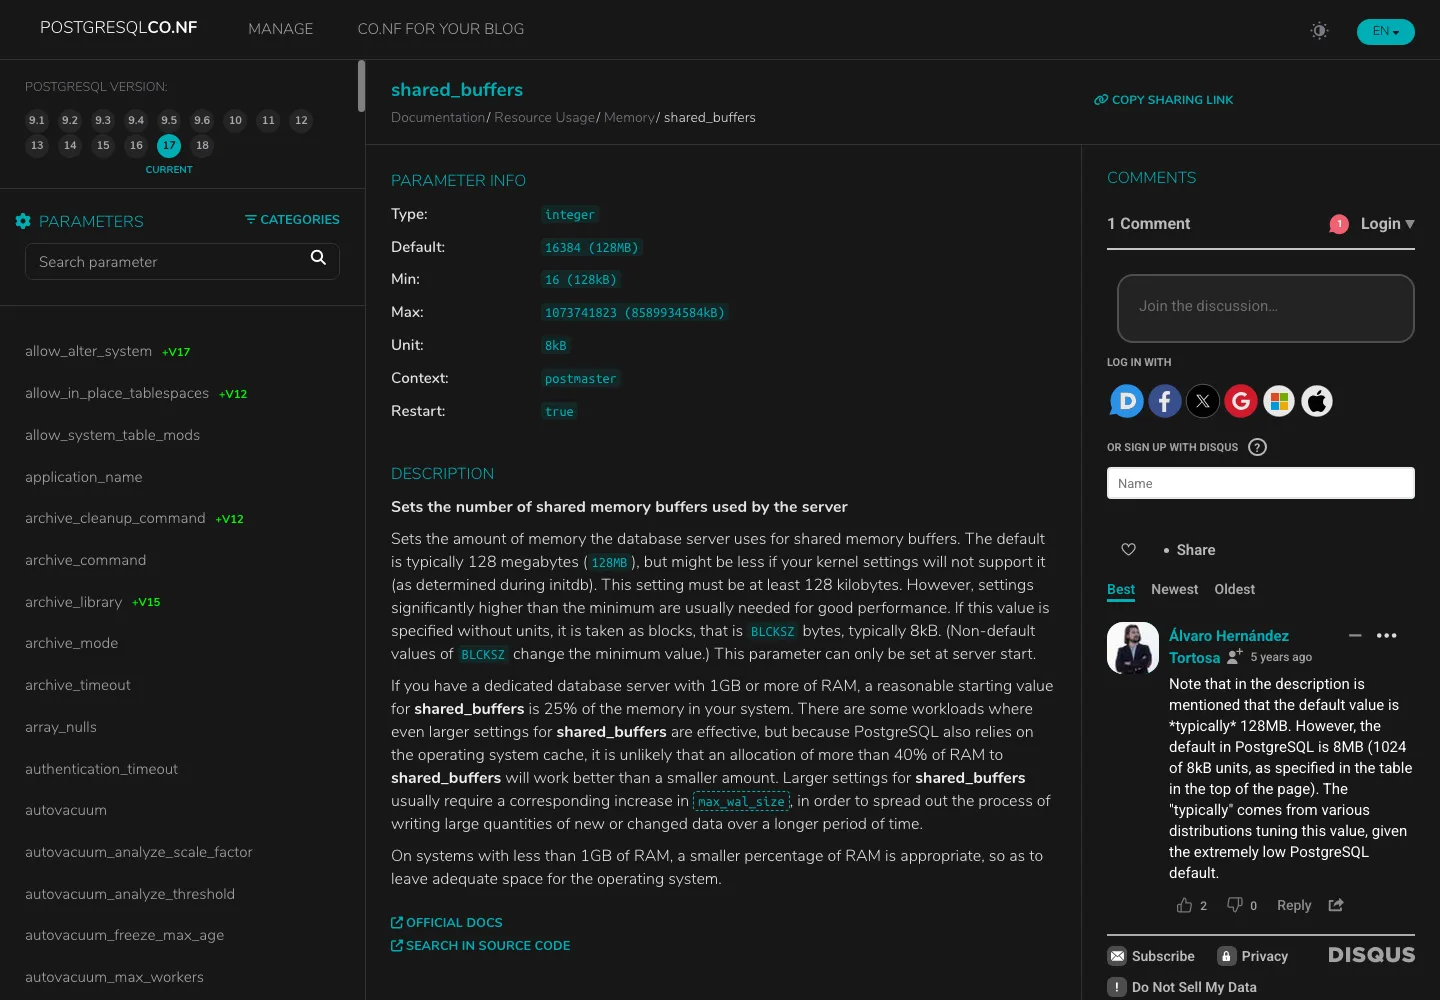
Figure 13: Real capture (postgresqlco.nf). This site catalogs every parameter’s default, range, and restart requirement — e.g. shared_buffers is marked Restart: true. Checking here before turning a knob avoids half the rookie mistakes.
Switch 10: random_page_cost 4 → 1.1, effective_io_concurrency 16 → 200. random_page_cost = 4 means “a random read costs 4x a sequential read” — pricing from the seek-time era. On NVMe SSDs, random and sequential reads cost nearly the same; after setting 1.1, the planner dares to choose index scans when appropriate. Pair it with effective_io_concurrency = 200 so PG 18’s new I/O subsystem can prefetch concurrently. As a bonus, PG 18 defaults to io_method = worker (background I/O workers), and on Linux kernel 5.1+ you can try io_uring — one of the secret weapons behind PG 18’s performance leap.
10. The Lazy Starting Point: PGTune Drafts Your Quote
If calculating 10 switches one by one feels tedious, the community has a ready-made “renovation quoter” — PGTune. Fill in your hardware and workload type, and it generates a configuration draft:
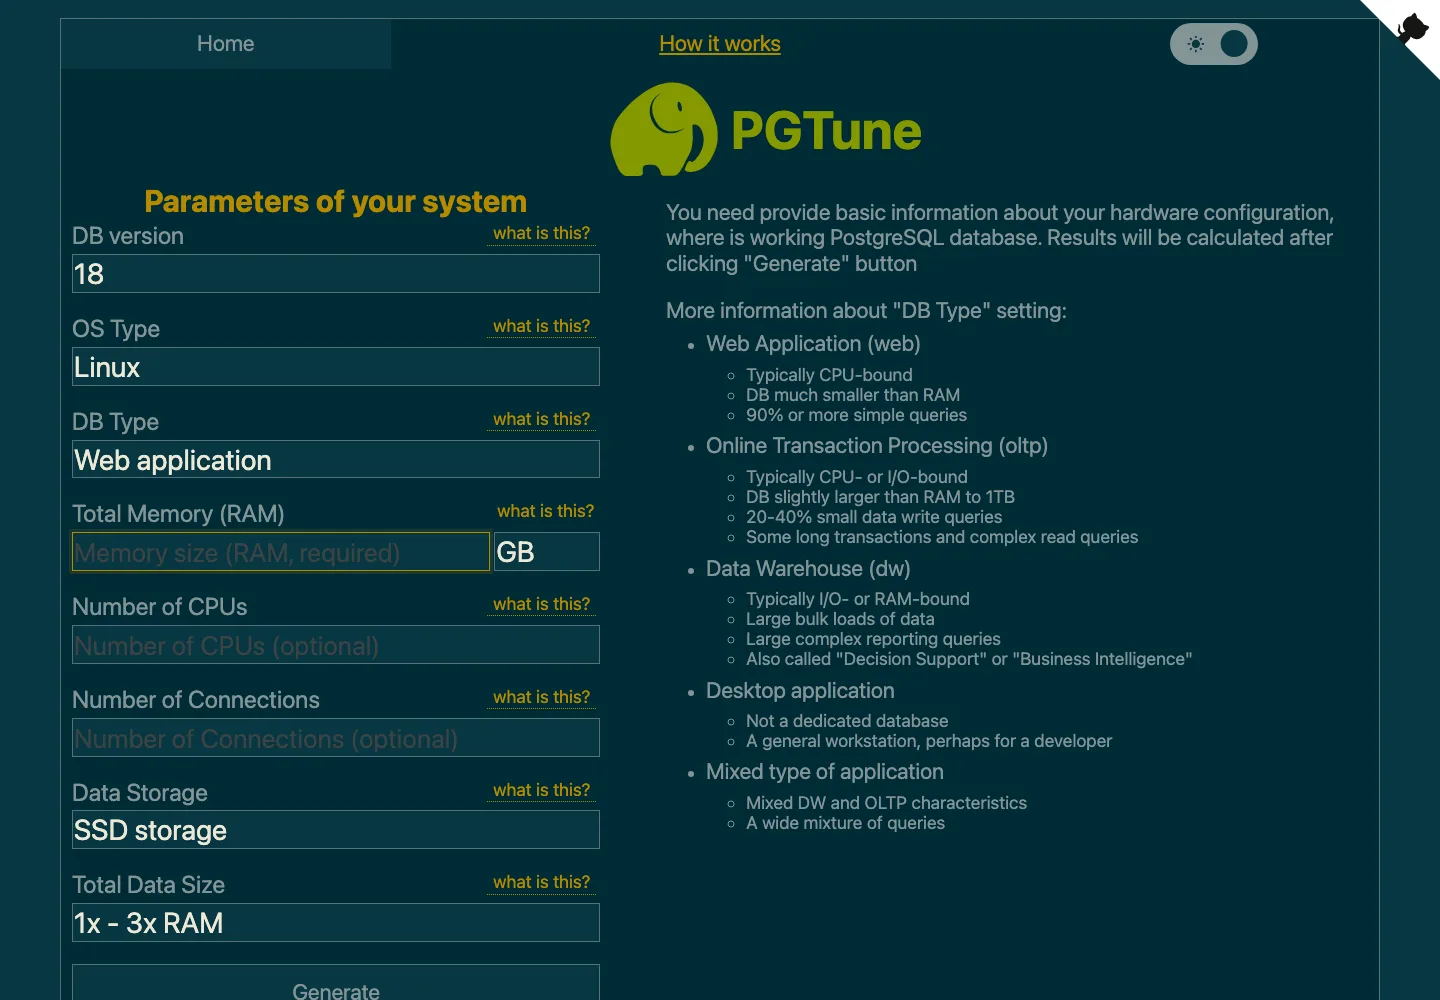
Figure 14: Real capture (pgtune.leopard.in.ua). Pick version, OS, workload type (Web/OLTP/DW), RAM, CPUs, storage type — one click generates a draft. Its values are a sensible starting point, not the finish line — only your monitoring knows your real workload.
11. One-Click Sandbox: Turn the 10 Switches Yourself
Reading is believing nothing. The three scripts below reproduce every experiment in this article on your own machine with Docker: start PG 18 → load 5M rows → inspect the default report card → baseline benchmark → experience 150-client rejection → apply 11 ALTER SYSTEM statements → restart → rematch at 150 clients. They depend only on local Docker and touch no third-party service.
11.1 Manual execution
Windows 11 (PowerShell, Docker Desktop running) — save as Start-PgTuningLab.ps1:
# Start-PgTuningLab.ps1 — PostgreSQL tuning sandbox (Windows 11)
$ErrorActionPreference = "Stop"
docker info | Out-Null
docker rm -f pg-tune-demo 2>$null | Out-Null
docker run -d --name pg-tune-demo -m 2g -e POSTGRES_PASSWORD='LabOnly!123' postgres:18 | Out-Null
do { Start-Sleep 2; docker exec pg-tune-demo pg_isready -U postgres 2>$null } until ($LASTEXITCODE -eq 0)
docker exec pg-tune-demo psql -U postgres -c "CREATE DATABASE bench;" | Out-Null
docker exec pg-tune-demo pgbench -i -s 50 --quiet -U postgres bench
Write-Host "== Default report card =="
docker exec pg-tune-demo psql -U postgres -d bench -c "SELECT name,setting,unit FROM pg_settings WHERE name IN ('shared_buffers','work_mem','max_connections','max_wal_size','random_page_cost') ORDER BY name;"
Write-Host "== Defaults, 150 clients (will be refused) =="
docker exec pg-tune-demo pgbench -c 150 -j 4 -T 20 -U postgres bench
$Tune = @"
ALTER SYSTEM SET shared_buffers='512MB'; ALTER SYSTEM SET effective_cache_size='1536MB';
ALTER SYSTEM SET work_mem='16MB'; ALTER SYSTEM SET maintenance_work_mem='256MB';
ALTER SYSTEM SET max_connections='300'; ALTER SYSTEM SET wal_compression='on';
ALTER SYSTEM SET max_wal_size='2GB'; ALTER SYSTEM SET checkpoint_timeout='15min';
ALTER SYSTEM SET random_page_cost='1.1'; ALTER SYSTEM SET effective_io_concurrency='200';
ALTER SYSTEM SET autovacuum_vacuum_scale_factor='0.05';
"@
$Tune | docker exec -i pg-tune-demo psql -U postgres -d bench
docker restart pg-tune-demo | Out-Null
do { Start-Sleep 2; docker exec pg-tune-demo pg_isready -U postgres 2>$null } until ($LASTEXITCODE -eq 0)
Write-Host "== Tuned, 150 clients rematch =="
docker exec pg-tune-demo pgbench -c 150 -j 4 -T 20 -U postgres bench
Write-Host "Done! Cleanup: docker rm -f pg-tune-demo"
Ubuntu 26.04 (Bash, Docker installed) — save as start-pg-tuning-lab.sh:
#!/usr/bin/env bash
# start-pg-tuning-lab.sh — PostgreSQL tuning sandbox (Ubuntu 26.04)
set -euo pipefail
docker info >/dev/null
docker rm -f pg-tune-demo 2>/dev/null || true
docker run -d --name pg-tune-demo -m 2g -e POSTGRES_PASSWORD='LabOnly!123' postgres:18 >/dev/null
until docker exec pg-tune-demo pg_isready -U postgres >/dev/null 2>&1; do sleep 2; done
docker exec pg-tune-demo psql -U postgres -c "CREATE DATABASE bench;" >/dev/null
docker exec pg-tune-demo pgbench -i -s 50 --quiet -U postgres bench
echo "== Default report card =="
docker exec pg-tune-demo psql -U postgres -d bench -c "SELECT name,setting,unit FROM pg_settings WHERE name IN ('shared_buffers','work_mem','max_connections','max_wal_size','random_page_cost') ORDER BY name;"
echo "== Defaults, 150 clients (will be refused) =="
docker exec pg-tune-demo pgbench -c 150 -j 4 -T 20 -U postgres bench || true
docker exec -i pg-tune-demo psql -U postgres -d bench <<'SQL'
ALTER SYSTEM SET shared_buffers='512MB'; ALTER SYSTEM SET effective_cache_size='1536MB';
ALTER SYSTEM SET work_mem='16MB'; ALTER SYSTEM SET maintenance_work_mem='256MB';
ALTER SYSTEM SET max_connections='300'; ALTER SYSTEM SET wal_compression='on';
ALTER SYSTEM SET max_wal_size='2GB'; ALTER SYSTEM SET checkpoint_timeout='15min';
ALTER SYSTEM SET random_page_cost='1.1'; ALTER SYSTEM SET effective_io_concurrency='200';
ALTER SYSTEM SET autovacuum_vacuum_scale_factor='0.05';
SQL
docker restart pg-tune-demo >/dev/null
until docker exec pg-tune-demo pg_isready -U postgres >/dev/null 2>&1; do sleep 2; done
echo "== Tuned, 150 clients rematch =="
docker exec pg-tune-demo pgbench -c 150 -j 4 -T 20 -U postgres bench
echo "Done! Cleanup: docker rm -f pg-tune-demo"
macOS 26 (zsh, Docker Desktop or colima running) — save as start-pg-tuning-lab.zsh; almost identical to the Ubuntu version, with the first line changed to #!/bin/zsh plus a startup check:
#!/bin/zsh
# start-pg-tuning-lab.zsh — PostgreSQL tuning sandbox (macOS 26)
if ! docker info >/dev/null 2>&1; then
  echo "Docker not ready: start Docker Desktop, or brew install colima && colima start"
  exit 1
fi
set -euo pipefail
# ... the rest is identical to the Ubuntu script ...
The sandbox values are sized for the 2GB container; on a real production box, scale them by the ratios in sections 5–9 (e.g. on 16GB, give shared_buffers 4GB).
11.2 Agent auto-configuration
If you have Kimi Code, Claude Code, Codex, or any agent that can run local commands, hand it this instruction directly:
Build a PostgreSQL 18 tuning sandbox on my machine with Docker and run a before/after tuning comparison. Requirements: 1) start a postgres:18 container (2GB memory limit, lab-only weak password), create a bench database and load pgbench scale 50 data; 2) show the default values of shared_buffers, work_mem, max_connections, max_wal_size, random_page_cost; 3) run pgbench -c 150 -j 4 -T 20 on defaults and record the outcome; 4) apply these via ALTER SYSTEM: shared_buffers=512MB, effective_cache_size=1536MB, work_mem=16MB, maintenance_work_mem=256MB, max_connections=300, wal_compression=on, max_wal_size=2GB, checkpoint_timeout=15min, random_page_cost=1.1, effective_io_concurrency=200, autovacuum_vacuum_scale_factor=0.05; restart the container and rerun the same pgbench command; 5) compare TPS and explain the difference; 6) never use any real business data from the host, and never print internal addresses, hostnames, or secrets; 7) when done, tell me the container name and the cleanup command.
The key to this prompt, again, is the constraints: Docker-only sandbox, no real data, and a required cleanup deliverable. Tuning experiments are like taste-testing — do them freely in your home kitchen (sandbox), never in the restaurant’s back of house (production).
12. The Safe Tuning Loop: Test the Water Like Adjusting a Shower
Finally, methodology. The biggest tuning risk isn’t a wrong parameter — it’s changing five at once and never knowing whose fault the outage was. The right posture is a closed loop:
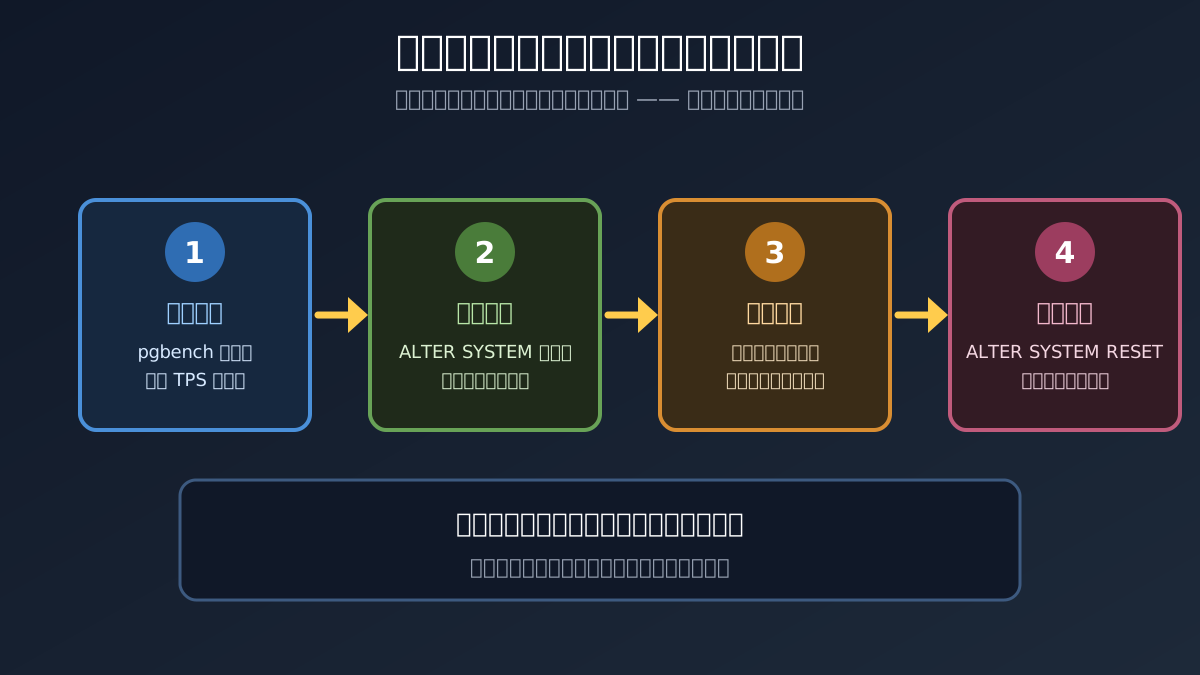
Figure 15: Self-made diagram. Baseline first, change one thing, re-measure, keep a retreat path. Every ALTER SYSTEM change can be withdrawn with ALTER SYSTEM RESET parameter (or RESET ALL) — PostgreSQL’s regret pill for DBAs.
I walked the full loop in the sandbox. After applying the 11 ALTER SYSTEM statements and restarting, the new report card:
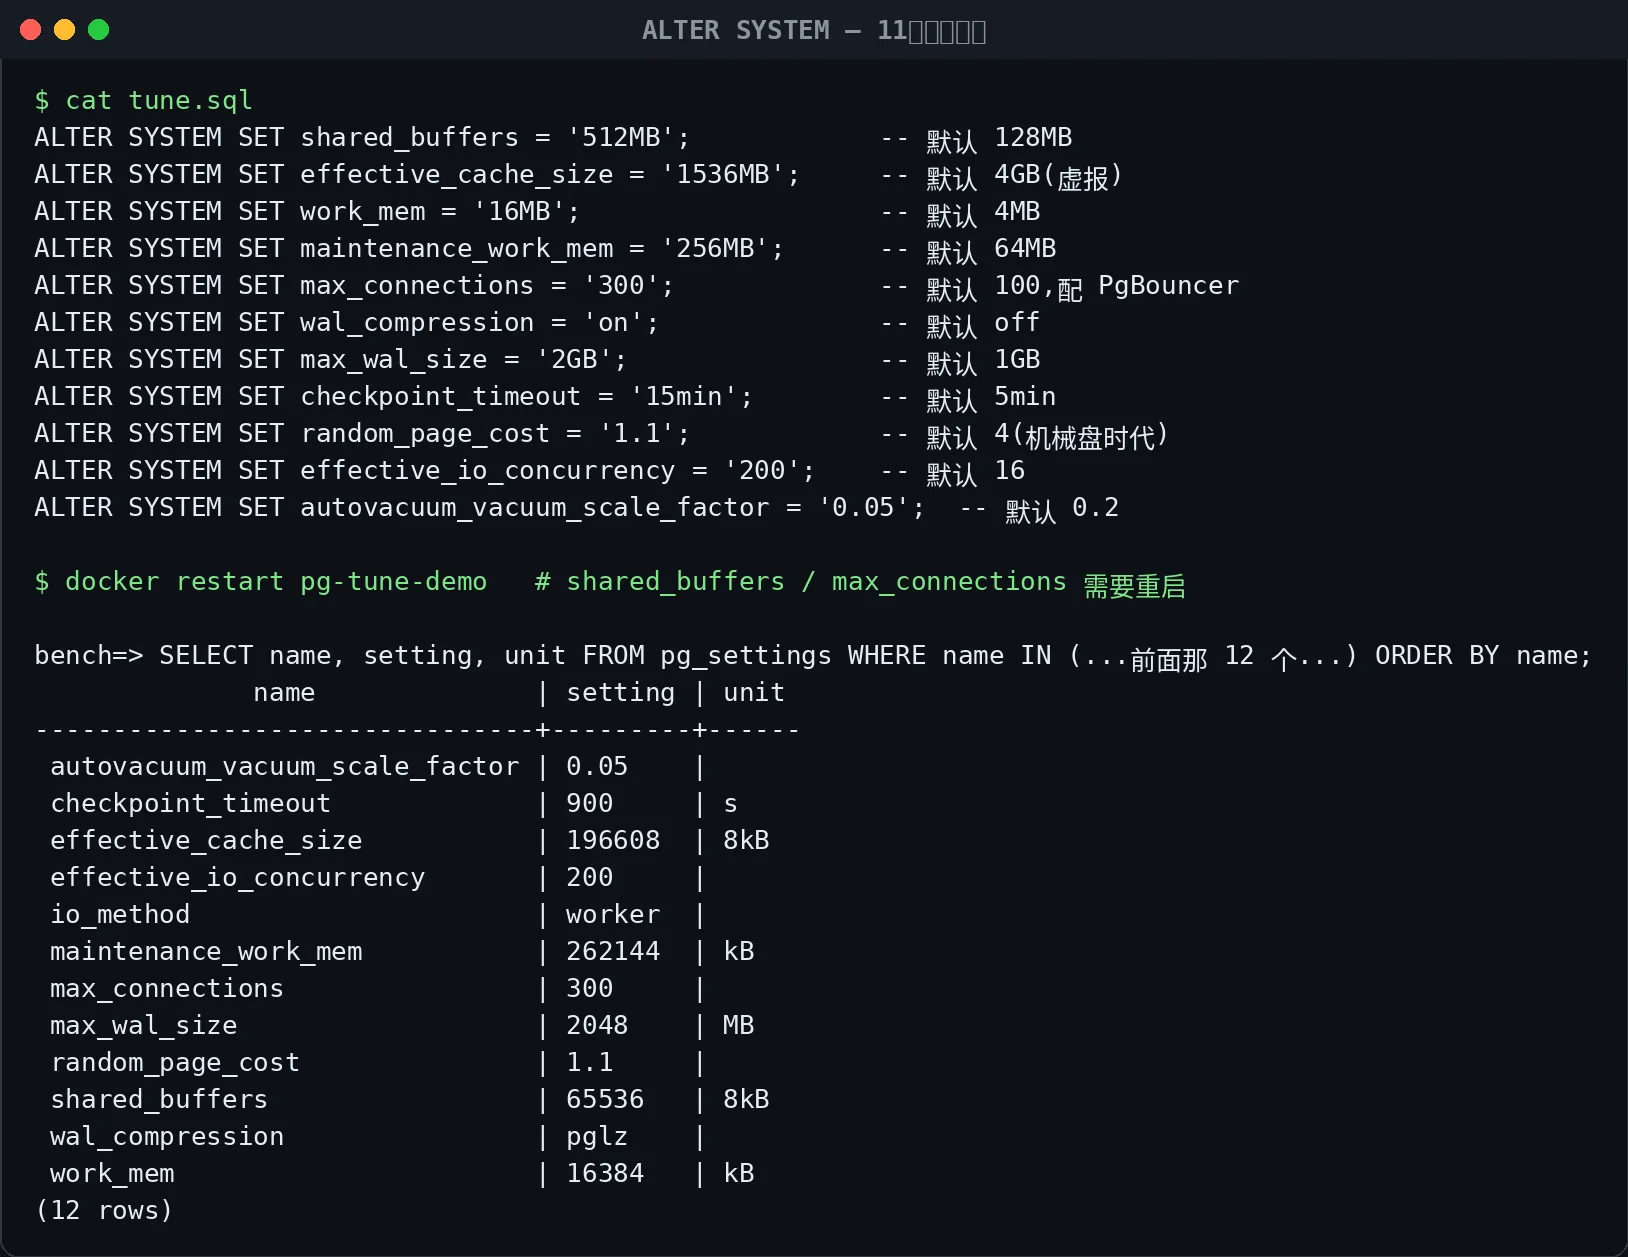
Figure 16: Real capture. All parameters in effect: shared_buffers 512MB, max_connections 300, wal_compression showing pglz (compression active), random_page_cost down to 1.1.
The same 150-client benchmark command went from “refused outright” to:
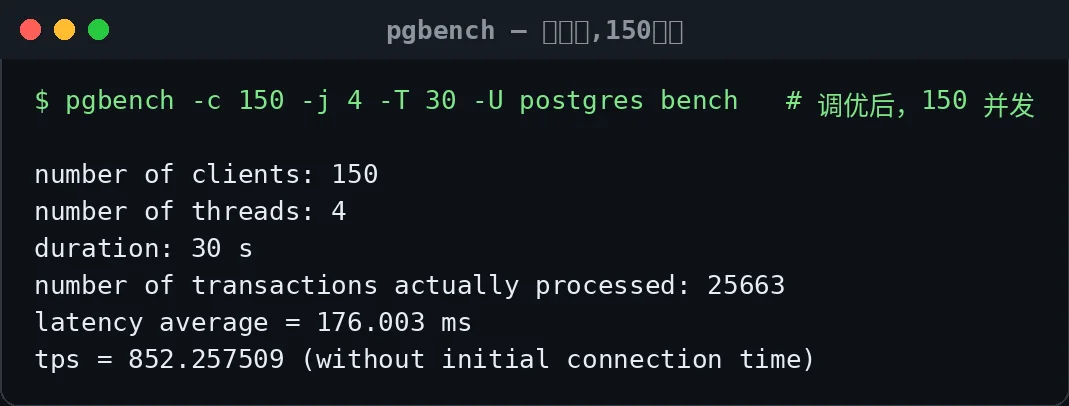
Figure 17: Real capture. 150 clients, 30 seconds, 25,663 transactions, 852 TPS. Compare with Figure 4’s “couldn’t even start” — that’s the value of a single max_connections parameter.
An honest footnote: at 16 clients the tuned instance was only ~4% faster (735 → 767 TPS). Tuning is not magic that turns 60 points into 100; it turns “hovering around the pass line” into “a stable 85 under any weather” — its battlefield is peaks, big queries, and connection storms, not calm-water benchmarks.
13. Q&A
Q1: Can I copy these values straight to production? Don’t copy the values; copy the method. The sandbox’s 512MB is sized for a 2GB container. Recalculate for production using “shared_buffers 25%, effective_cache_size 50%~75%, work_mem by concurrency budget,” and verify each change through the loop in section 12.
Q2: Can tuning break the database? What’s the worst case? The classic accident is memory oversubscription: shared_buffers + max_connections × work_mem × 2 exceeds physical RAM, and the OOM killer shoots the database. Do the arithmetic on paper before you start and you’ll be fine. And if you do mis-set something, ALTER SYSTEM RESET rolls back in one command.
Q3: Which parameters need a restart, and which apply live? shared_buffers and max_connections require a restart; work_mem, effective_cache_size, wal_compression, and the autovacuum family only need a reload (some apply instantly). Check a parameter’s Context on postgresqlco.nf: postmaster = restart, sighup = reload.
Q4: Can I change these on cloud RDS? Mostly yes — the vendor’s parameter group exposes them, and many RDS defaults are already saner than upstream. But business-specific knobs like random_page_cost and autovacuum thresholds remain conservative in the cloud and deserve a pass with this article’s approach.
Q5: Is bigger work_mem always better?
Quite the opposite. It’s billed per connection per operation; a 10x increase can multiply peak memory by dozens. Give slow report queries a session-level SET LOCAL work_mem = '256MB' treat, and keep the global value restrained.
Q6: Am I done after tuning parameters? No. Parameters set the “resource budget,” but the bulk of slow queries are unreasonable SQL and missing indexes. Next post we’ll cover pg_stat_statements — finding the 10 queries most worth optimizing beats blind knob-turning every time.
14. Closing
And with that, the PostgreSQL trilogy is complete: part one covered why move, part two how to move, and this one how to renovate after moving in.
Looking back across the series, the most interesting pattern is that PostgreSQL’s “defaults” mirror its governance — it hands you the choice and the responsibility together. No vendor picks your defaults for you, just as no vendor can take the project away. The price of freedom is learning these 10 switches; the reward is a database that breathes to your business’s rhythm instead of 1996’s hardware spec.
A week to move, a day to renovate, years of comfortable living.
References: PostgreSQL Docs: Resource Consumption, postgresqlco.nf parameter encyclopedia, PGTune, PgBouncer, pgbench documentation, PostgreSQL 18 release announcement.