Adding Proxmox VE local-lvm Usage and Link-Speed Monitoring to Uptime Kuma
Short version
Proxmox VE
local-lvmis usually an LVM-thin pool, not a normal mounted directory, sodf -his not enough to catch it before it becomes full. Network link speed is another quiet failure mode: services may stay online while a NAS or router uplink falls back to 100 Mb/s and turns large file transfers into a crawl. A practical fix is to feed both checks into the Uptime Kuma you already use: expose a small HTTP health endpoint forlocal-lvm, and push link-speed status from the Proxmox host with anethtoolscript.
This article walks through the design, the problems in a naive implementation, improved scripts, systemd units, Uptime Kuma configuration, verification steps, and safety notes. All addresses, tokens, host names, and environment-specific values are placeholders. Replace <PVE_HOST>, <KUMA_URL>, <PUSH_TOKEN>, and <INTERFACE> with values from your own environment.
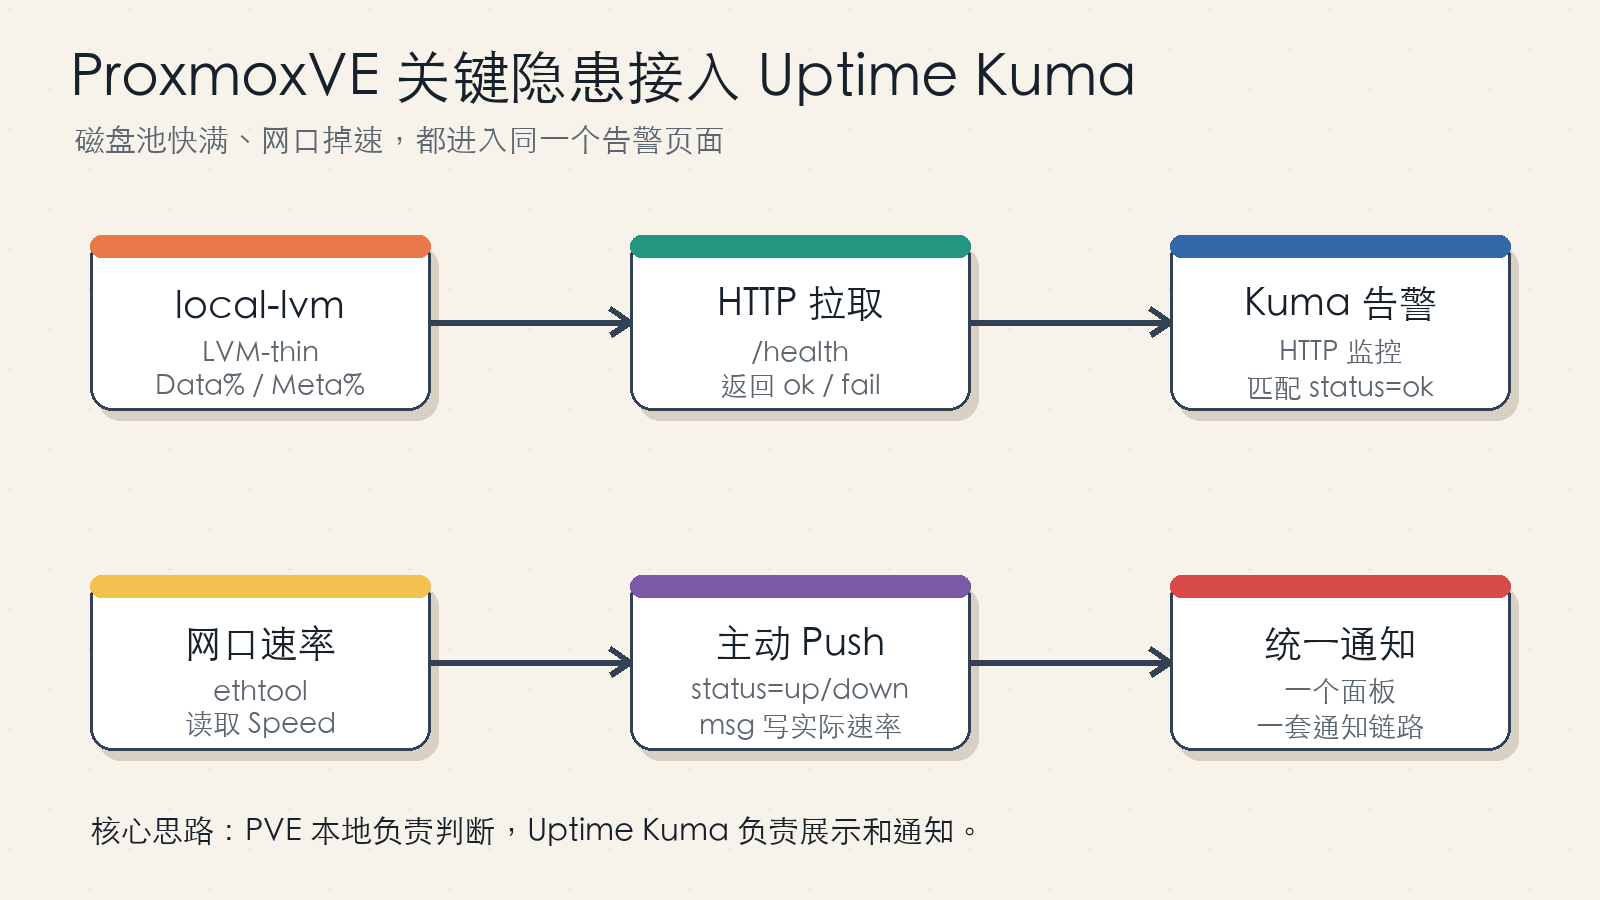
Figure 1: The disk check is pulled by Uptime Kuma through a small HTTP endpoint. The link-speed check is pushed by the Proxmox host on a schedule.
1. Why Monitor These Two Things Separately
Many infrastructure failures do not look like a full outage at first. The web UI still opens, but background jobs fail. A database still accepts connections, but writes become unstable. A virtual machine keeps running, but snapshots or backups start to fail. A NAS still responds, but file transfers drop from more than 100 MB/s to roughly 10 MB/s.
In these cases, it is easy to start from the wrong layer. You may inspect application logs, database permissions, network shares, authentication, caches, and reverse proxies before noticing that the underlying storage pool is almost full or that a cable negotiated at 100 Mb/s.
local-lvm usage and physical link speed share three useful properties:
- They are low-level indicators that can break higher-level services in indirect ways.
- Their healthy state is simple to express as a threshold or expected value.
- They are too small to justify a full metrics stack in many home-lab or small-team setups.
If Uptime Kuma is already your unified page for websites, ports, certificates, and service health, adding these two checks to the same dashboard is a pragmatic choice. Uptime Kuma is not a full observability platform, but it is very good at binary health checks with notifications.
The goal here is narrow:
- Alert when a Proxmox VE
local-lvmthin pool crosses a usage threshold. - Alert when a selected network interface is not running at the expected link speed.
2. What Needed Correction in the Naive Version
The original idea is sound: expose a Proxmox-side HTTP endpoint for the LVM check, and use a Proxmox-side scheduled script to push link-speed status to Uptime Kuma. However, a direct copy has several weak spots.
2.1 HTTP 200 Alone Is Not Enough
If the Python HTTP server always returns 200, Uptime Kuma may treat the monitor as healthy even when the JSON body says "status":"fail". A stronger design does both:
- Return
503when the check fails. - Configure a Uptime Kuma keyword match such as
"status":"ok".
The status code catches coarse failures. The keyword match catches unexpected output, proxy mistakes, or script errors that still produce an HTTP response.
2.2 LVM Thin Pools Have Data and Metadata Usage
An LVM-thin pool has both data and metadata areas. Data% approaching 100% is dangerous, and Meta% approaching 100% is dangerous as well. The improved rule is therefore:
Mark the check as failed when either Data% or Meta% reaches the threshold.
This follows the LVM thin provisioning documentation, which exposes both data_percent and metadata_percent for thin pool monitoring.
2.3 Filtering by pool_lv == data Is Too Specific
Some installations use the default pve/data naming, but not all of them. A more robust check identifies thin pool logical volumes from lvs output and reads their own data_percent and metadata_percent. If you truly want to watch only one pool, add an explicit allowlist variable instead of depending on a default name.
2.4 Push Messages Must Be URL-Encoded
A message like actual=100Mb/s expected=1000Mb/s contains characters that should be encoded in a URL. The script should use curl --get --data-urlencode instead of concatenating query strings by hand.
2.5 Push Tokens Are Write Credentials
The token in a Uptime Kuma Push URL lets anyone who has it report up or down for that monitor. Do not publish real Push URLs in articles, screenshots, repositories, or chat logs. Use placeholders in documentation and keep the real values in local configuration files.
3. Pull Versus Push
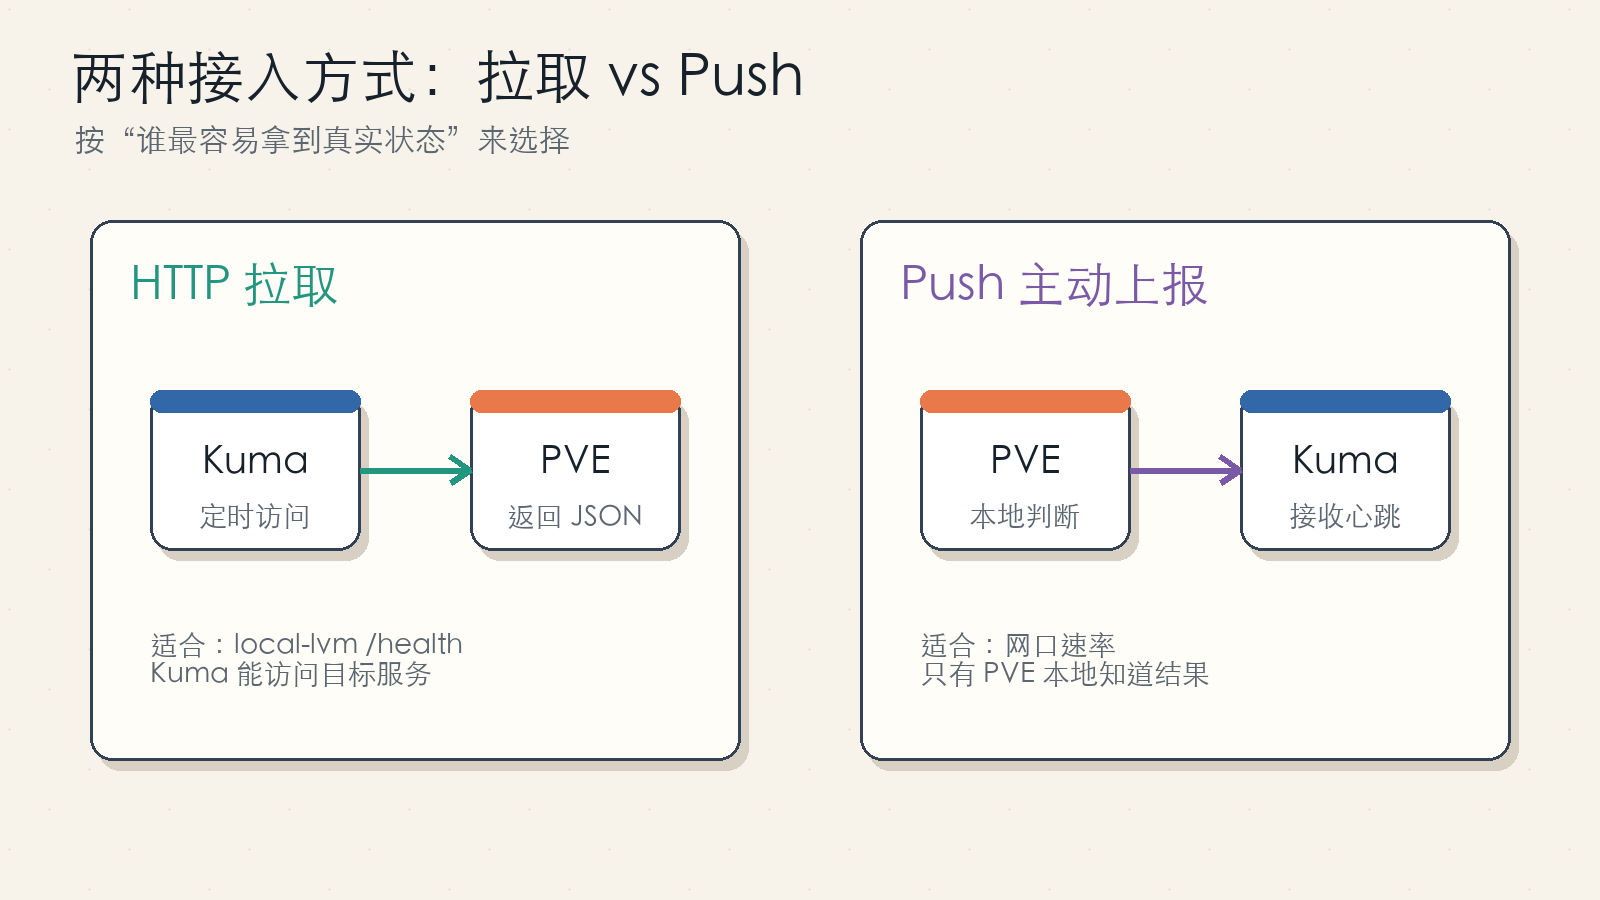
Figure 2: Use pull checks when Uptime Kuma can reach the target endpoint. Use Push when the monitored host must decide the result locally.
The local-lvm check uses a pull model. The Proxmox host runs a read-only health endpoint, and Uptime Kuma periodically calls:
http://<PVE_HOST>:8080/health
The link-speed check uses a Push model. The Proxmox host runs ethtool, decides whether the current speed matches the expected value, and calls:
https://<KUMA_URL>/api/push/<PUSH_TOKEN>
A useful rule of thumb:
- If Uptime Kuma can directly reach a lightweight health endpoint, use HTTP pull.
- If only the monitored host can calculate the result, use Push.
4. Why df -h Does Not Solve local-lvm
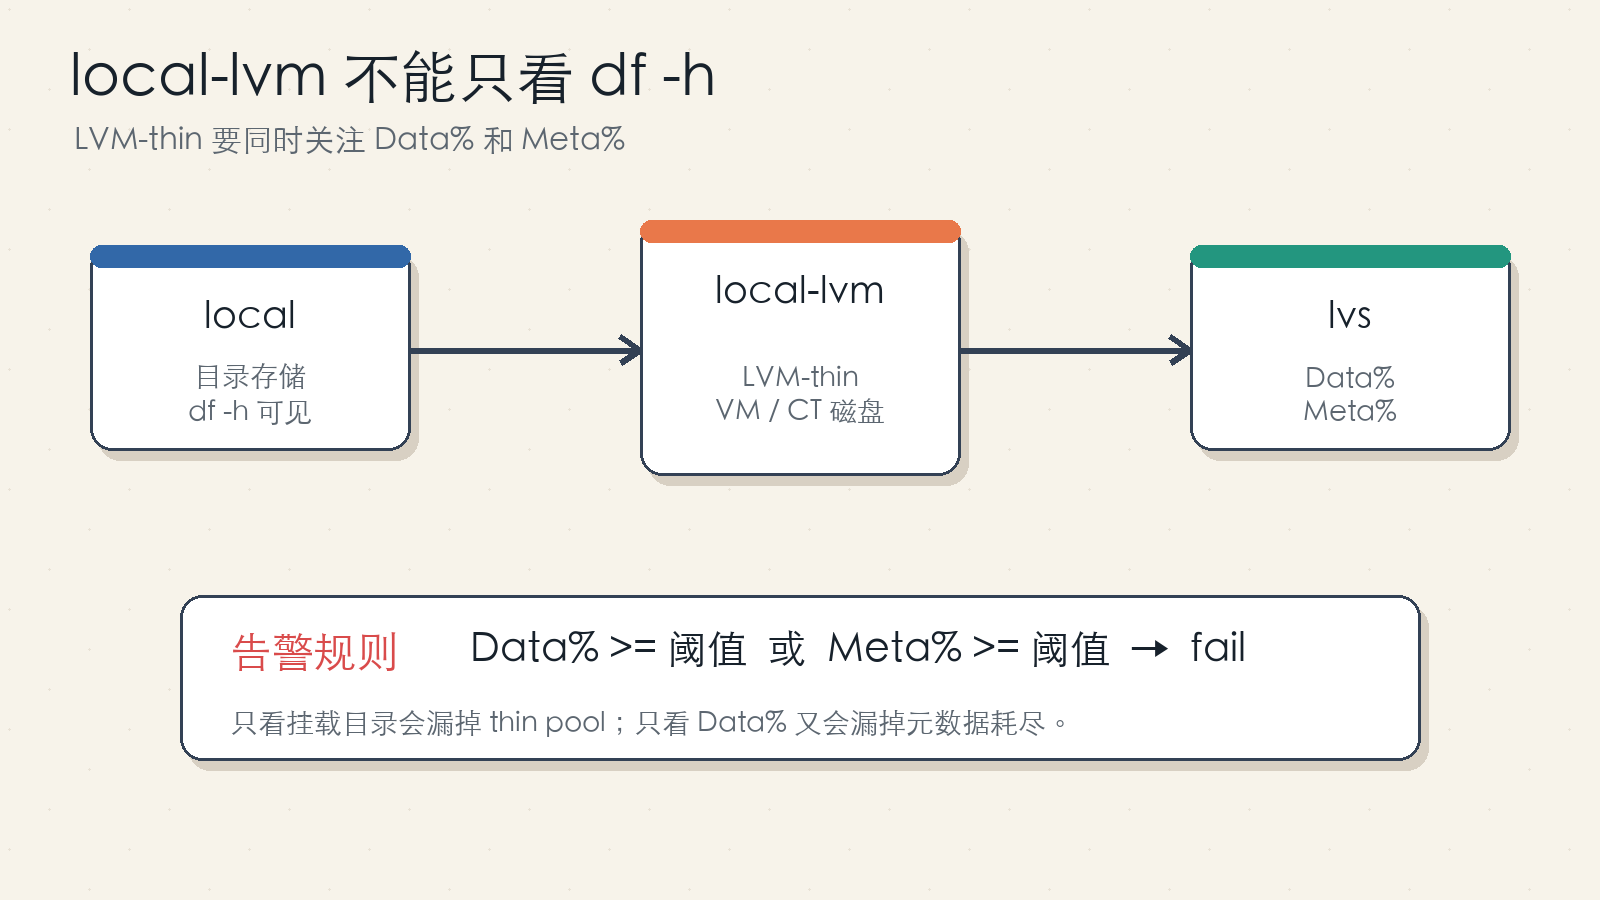
Figure 3: local is commonly a directory storage. local-lvm is commonly an LVM-thin block storage used for VM and container disks.
Proxmox VE often has two local storage entries:
local: directory storage, commonly used for ISO files, templates, and some backups.local-lvm: LVM-thin storage, commonly used for VM disks and container root filesystems.
The first one is visible through normal filesystem tools. The second one is a thin pool and should be checked with LVM tools:
lvs -o lv_name,vg_name,lv_size,data_percent,metadata_percent,lv_attr,pool_lv
The Proxmox web UI can show some of this information, but monitoring needs a stable machine-readable result. That is why the implementation below reads lvs directly and converts it into a small JSON health response.
5. Improved LVM Check Script
Save this as /usr/local/bin/lvm_check.sh and make it executable:
#!/usr/bin/env bash
set -euo pipefail

THRESHOLD="${THRESHOLD:-90}"
LVS_BIN="${LVS_BIN:-/sbin/lvs}"

if ! command -v jq >/dev/null 2>&1; then
  echo '{"status":"fail","error":"jq is required"}'
  exit 2
fi

"$LVS_BIN" --reportformat json --units g --nosuffix \
  -o lv_name,vg_name,lv_size,data_percent,metadata_percent,lv_attr,pool_lv |
jq --argjson threshold "$THRESHOLD" '
  .report[0].lv
  | map(select(((.lv_attr // "") | startswith("t")) or ((.data_percent // "") != "" and (.metadata_percent // "") != "")))
  | map({
      lv: .lv_name,
      vg: .vg_name,
      size_g: .lv_size,
      data_percent: ((.data_percent // "0") | tonumber),
      metadata_percent: ((.metadata_percent // "0") | tonumber)
    })
  | {
      status: (if any(.[]; .data_percent >= $threshold or .metadata_percent >= $threshold) then "fail" else "ok" end),
      threshold: $threshold,
      volumes: map(select(.data_percent >= $threshold or .metadata_percent >= $threshold))
    }
'
Install dependencies and permissions:
apt update
apt install -y jq
install -m 0755 lvm_check.sh /usr/local/bin/lvm_check.sh
Healthy output looks like this:
{
  "status": "ok",
  "threshold": 90,
  "volumes": []
}
When a pool crosses the threshold, the response includes the affected volume:
{
  "status": "fail",
  "threshold": 90,
  "volumes": [
    {
      "lv": "data",
      "vg": "pve",
      "size_g": "900.00",
      "data_percent": 93.2,
      "metadata_percent": 41.8
    }
  ]
}
The values above are examples only.
6. LVM HTTP Health Service
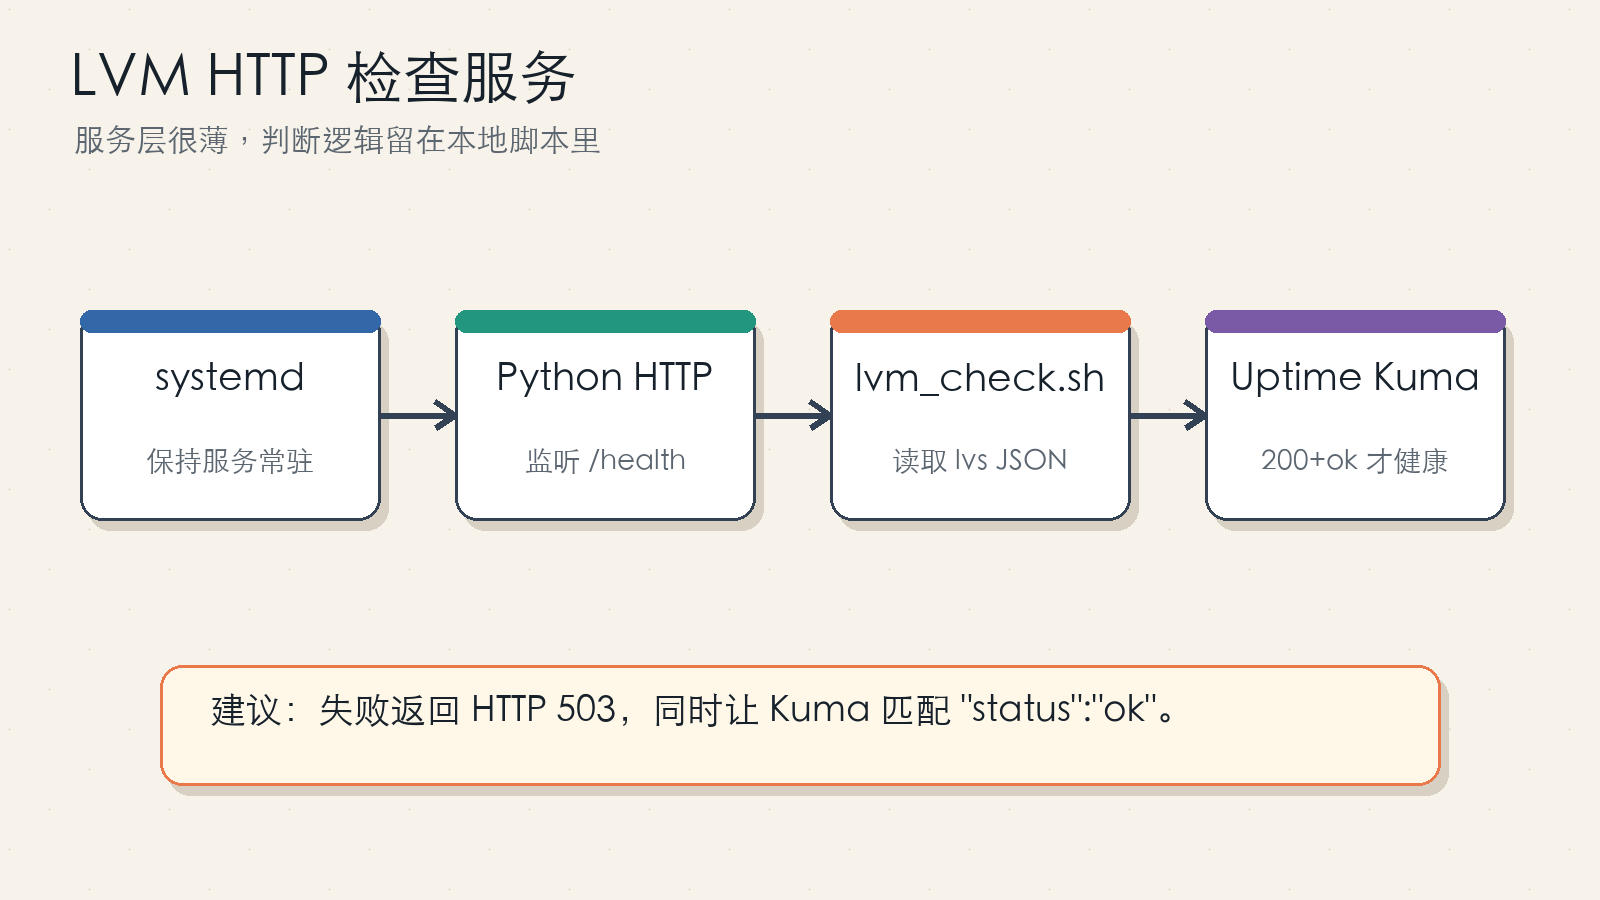
Figure 4: The HTTP layer is intentionally thin. The shell script remains testable on its own.
Save this as /root/TOOLS/lvm_http_server.py:
#!/usr/bin/env python3
from http.server import BaseHTTPRequestHandler, HTTPServer
import json
import subprocess

CHECK_CMD = ["/usr/local/bin/lvm_check.sh"]


class LVMCheckHandler(BaseHTTPRequestHandler):
    def log_message(self, fmt, *args):
        return

    def do_GET(self):
        if self.path not in ("/", "/health"):
            self.send_response(404)
            self.end_headers()
            self.wfile.write(b"not found\n")
            return

        result = subprocess.run(CHECK_CMD, stdout=subprocess.PIPE, stderr=subprocess.PIPE, text=True)
        body = result.stdout.strip() or '{"status":"fail","error":"empty output"}'

        status_code = 200
        try:
            payload = json.loads(body)
            if result.returncode != 0 or payload.get("status") != "ok":
                status_code = 503
        except json.JSONDecodeError:
            status_code = 503
            body = json.dumps({"status": "fail", "error": "invalid json from lvm_check.sh"})

        self.send_response(status_code)
        self.send_header("Content-Type", "application/json; charset=utf-8")
        self.end_headers()
        self.wfile.write((body + "\n").encode("utf-8"))


if __name__ == "__main__":
    HTTPServer(("0.0.0.0", 8080), LVMCheckHandler).serve_forever()
systemd unit at /etc/systemd/system/lvm-http.service:
[Unit]
Description=ProxmoxVE LVM thin pool health HTTP service
After=network-online.target
Wants=network-online.target

[Service]
Type=simple
ExecStart=/usr/bin/python3 /root/TOOLS/lvm_http_server.py
Restart=always
RestartSec=5
User=root

[Install]
WantedBy=multi-user.target
Enable and test it:
systemctl daemon-reload
systemctl enable --now lvm-http.service
systemctl status lvm-http.service --no-pager
curl -sS http://127.0.0.1:8080/health
The endpoint should be reachable only from trusted networks or through an internal reverse proxy. It is read-only, but there is no reason to expose it publicly.
7. Uptime Kuma HTTP Monitor
Create a new HTTP(s) monitor:
- Type:
HTTP(s). - URL:
http://<PVE_HOST>:8080/health. - Method:
GET. - Keyword:
"status":"ok"or"status": "ok", depending on the exact JSON formatting. - Heartbeat interval: 60 to 300 seconds, depending on how quickly you want to know.
- Retries: more than 1, to reduce false alerts during restarts.
The HTTP service already returns 503 on failure, but the keyword match is still useful as a second guard.
8. Link-Speed Push Script
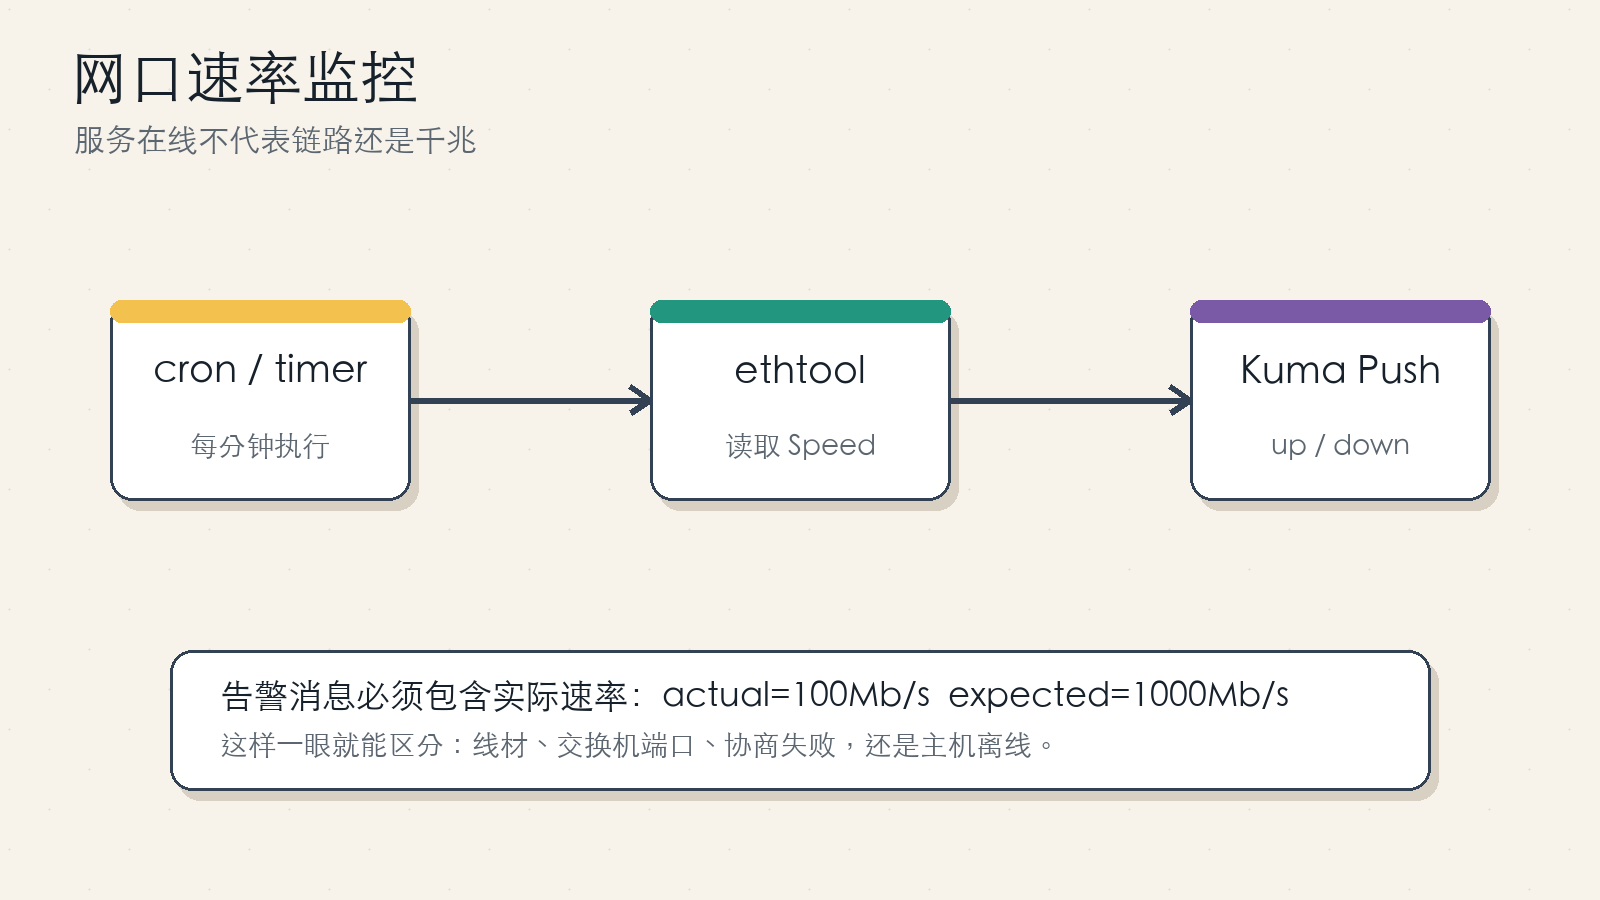
Figure 5: Put the actual speed in the Push message so the alert is immediately actionable.
Save this as /usr/local/bin/lan_speed_checker.sh:
#!/usr/bin/env bash
set -euo pipefail

INTERFACE="${INTERFACE:-<INTERFACE>}"
EXPECTED_SPEED="${EXPECTED_SPEED:-1000Mb/s}"
PUSH_URL="${PUSH_URL:-https://<KUMA_URL>/api/push/<PUSH_TOKEN>}"

if ! command -v ethtool >/dev/null 2>&1; then
  STATUS="down"
  MSG="ethtool not installed"
  PING="0"
else
  SPEED="$(ethtool "$INTERFACE" 2>/dev/null | awk -F': ' '/Speed:/ {print $2; exit}')"
  SPEED="${SPEED:-unknown}"
  if [ "$SPEED" = "$EXPECTED_SPEED" ]; then
    STATUS="up"
    MSG="link speed ok: ${INTERFACE} ${SPEED}"
    PING="1"
  else
    STATUS="down"
    MSG="link speed abnormal: ${INTERFACE} actual=${SPEED} expected=${EXPECTED_SPEED}"
    PING="0"
  fi
fi

curl -fsS --get "$PUSH_URL" \
  --data-urlencode "status=${STATUS}" \
  --data-urlencode "msg=${MSG}" \
  --data-urlencode "ping=${PING}" >/dev/null
Install dependencies and permissions:
apt update
apt install -y ethtool curl
install -m 0755 lan_speed_checker.sh /usr/local/bin/lan_speed_checker.sh
Test it manually:
INTERFACE="<INTERFACE>" \
EXPECTED_SPEED="1000Mb/s" \
PUSH_URL="https://<KUMA_URL>/api/push/<PUSH_TOKEN>" \
/usr/local/bin/lan_speed_checker.sh
For 2.5G, 5G, or 10G links, set EXPECTED_SPEED to 2500Mb/s, 5000Mb/s, or 10000Mb/s.
9. Scheduling the Push Check
The simplest option is cron:
PATH=/sbin:/bin:/usr/sbin:/usr/bin:/usr/local/sbin:/usr/local/bin
* * * * * INTERFACE=<INTERFACE> EXPECTED_SPEED=1000Mb/s PUSH_URL=https://<KUMA_URL>/api/push/<PUSH_TOKEN> /usr/local/bin/lan_speed_checker.sh
For better logs and cleaner secret handling, place variables in /etc/default/lan-speed-checker:
INTERFACE=<INTERFACE>
EXPECTED_SPEED=1000Mb/s
PUSH_URL=https://<KUMA_URL>/api/push/<PUSH_TOKEN>
Then use a systemd service:
[Unit]
Description=Push network link speed status to Uptime Kuma

[Service]
Type=oneshot
EnvironmentFile=/etc/default/lan-speed-checker
ExecStart=/usr/local/bin/lan_speed_checker.sh
And a timer:
[Unit]
Description=Run link speed checker every minute

[Timer]
OnBootSec=30
OnUnitActiveSec=60
AccuracySec=10
Unit=lan-speed-checker.service

[Install]
WantedBy=timers.target
Enable it:
systemctl daemon-reload
systemctl enable --now lan-speed-checker.timer
systemctl list-timers --all | grep lan-speed-checker
Cron is fine for a small home setup. systemd timers are nicer when you want logs and repeatable operations across multiple hosts.
10. Uptime Kuma Push Monitor
Create a new Push monitor in Uptime Kuma. After saving, Uptime Kuma will show a URL similar to:
https://<KUMA_URL>/api/push/<PUSH_TOKEN>?status=up&msg=OK&ping=
Use only the base URL in the script:
https://<KUMA_URL>/api/push/<PUSH_TOKEN>
The script adds status, msg, and ping. If your script runs once per minute, set the heartbeat interval around 60 seconds and add a small grace period.
There are two different failure modes:
status=down: the host ran the script and reported an abnormal speed.- No Push received: the host, cron job, network path, token, or Uptime Kuma endpoint may be broken.
Both deserve alerts, but they point to different troubleshooting paths.
11. Verification Checklist
For LVM:
/usr/local/bin/lvm_check.sh | jq .
curl -i http://127.0.0.1:8080/health
systemctl status lvm-http.service --no-pager
You should see valid JSON, HTTP 200 in the healthy case, and status set to ok.
To test the failure branch safely, lower the threshold temporarily:
THRESHOLD=1 /usr/local/bin/lvm_check.sh
Do not fill a real disk just to test an alert.
For link speed:
ethtool <INTERFACE> | grep -E 'Speed|Duplex|Link detected'
INTERFACE=<INTERFACE> EXPECTED_SPEED=1000Mb/s PUSH_URL=https://<KUMA_URL>/api/push/<PUSH_TOKEN> /usr/local/bin/lan_speed_checker.sh
To test the down branch, temporarily set EXPECTED_SPEED to an impossible value and confirm that Uptime Kuma reports down. Restore the real value immediately afterward.
12. Security and Maintenance Notes
Do not publish real Push tokens, private IP addresses, internal host names, or secrets. Put real values in root-owned local configuration files and restrict permissions:
chmod 600 /etc/default/lan-speed-checker
Keep the LVM HTTP endpoint internal. It should be reachable by Uptime Kuma, not by the public Internet.
Set thresholds before the last possible moment. Alerting at 99% is usually too late for a thin pool. Start with 85% or 90%, then tune based on your growth rate.
Use the actual expected speed for each host. A 2.5G NAS should expect 2500Mb/s; a management-only 100M port should not be forced into a gigabit rule.
Finally, make alert messages actionable. down is technically correct, but actual=100Mb/s expected=1000Mb/s is what saves time during an incident.
13. References
- Proxmox VE LVM-thin storage documentation:
https://pve.proxmox.com/pve-docs/pve-storage-lvmthin-plain.html - LVM thin provisioning manual:
https://man7.org/linux/man-pages/man7/lvmthin.7.html - Uptime Kuma Push endpoint documentation:
https://github.com/louislam/uptime-kuma/wiki/Internal-API
14. Wrap-Up
This setup is intentionally small. It does not try to replace a metrics stack. It simply turns two hidden infrastructure states into normal Uptime Kuma health checks.
When local-lvm fills up, the blast radius includes VM disks, containers, snapshots, backups, and write stability. When a link falls back to 100 Mb/s, NAS transfers, backups, sync jobs, and media workflows all suffer while the service itself may still look “up”.
Once these checks are in Uptime Kuma, troubleshooting becomes shorter. If the alert is red, fix the infrastructure first. If it is green, continue up the stack. That small change prevents a surprising number of “it worked yesterday” incidents.